 1
1peptide
spectrum
NA | NA
NA | NA
NA | NA
NA | NA
NA | NA
NA | NA
NA | NA
NA | NA
4peptides
spectra
0.000 | 0.000
1.000 | 1.000
1peptide
spectrum
NA | NA
NA | NA
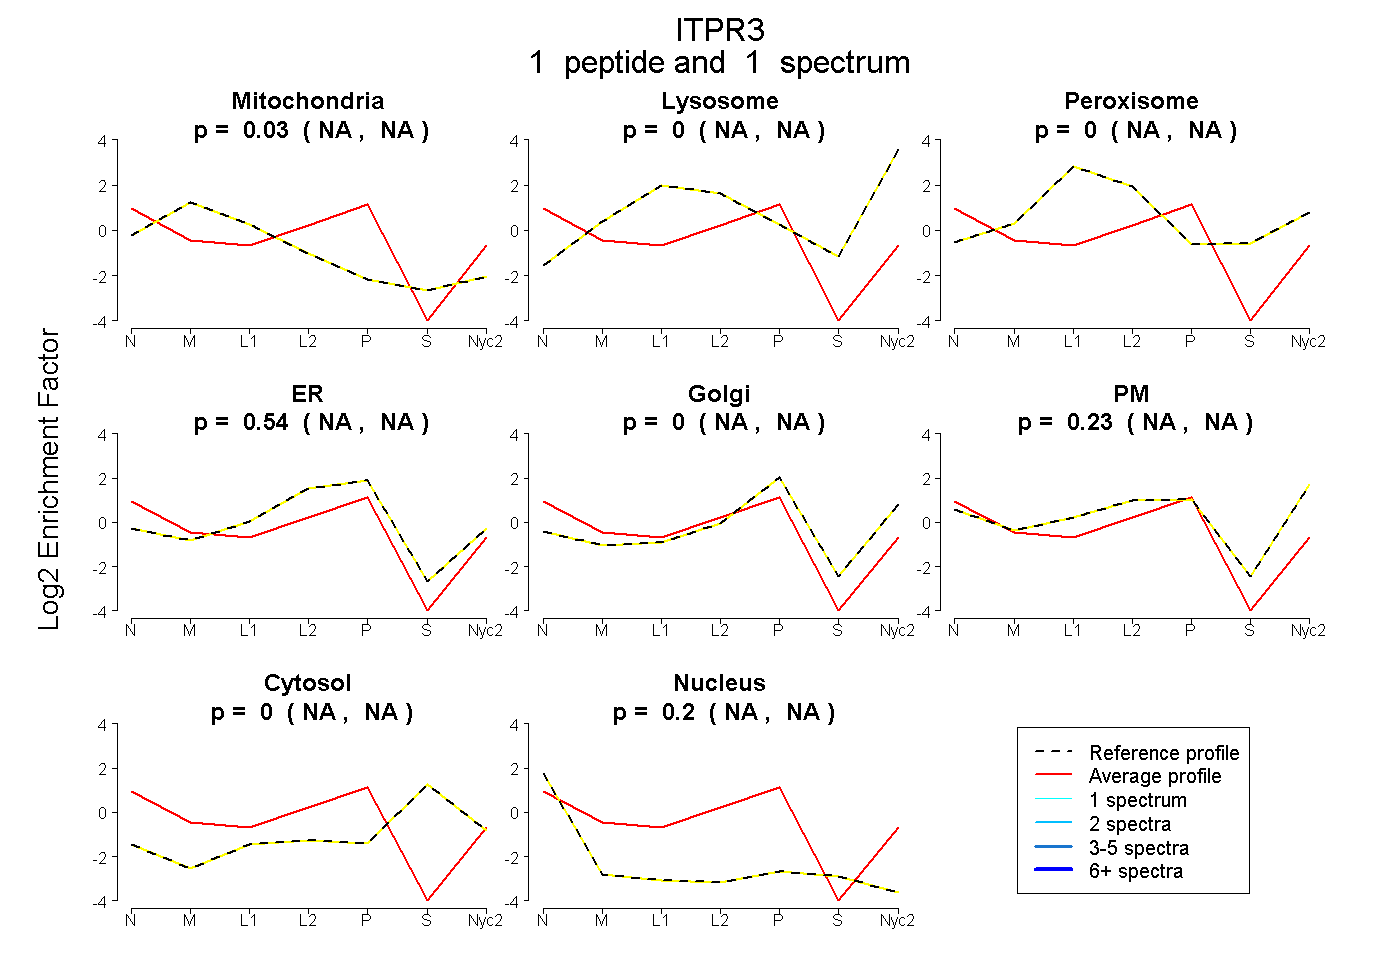
| Plot | Mito | Lyso | Perox | ER | Golgi | PM | Cytosol | Nucleus | |||||
| Expt A |
1 peptide |
1 spectrum |
|
0.033 NA | NA |
0.000 NA | NA |
0.000 NA | NA |
0.541 NA | NA |
0.000 NA | NA |
0.226 NA | NA |
0.000 NA | NA |
0.200 NA | NA |
||
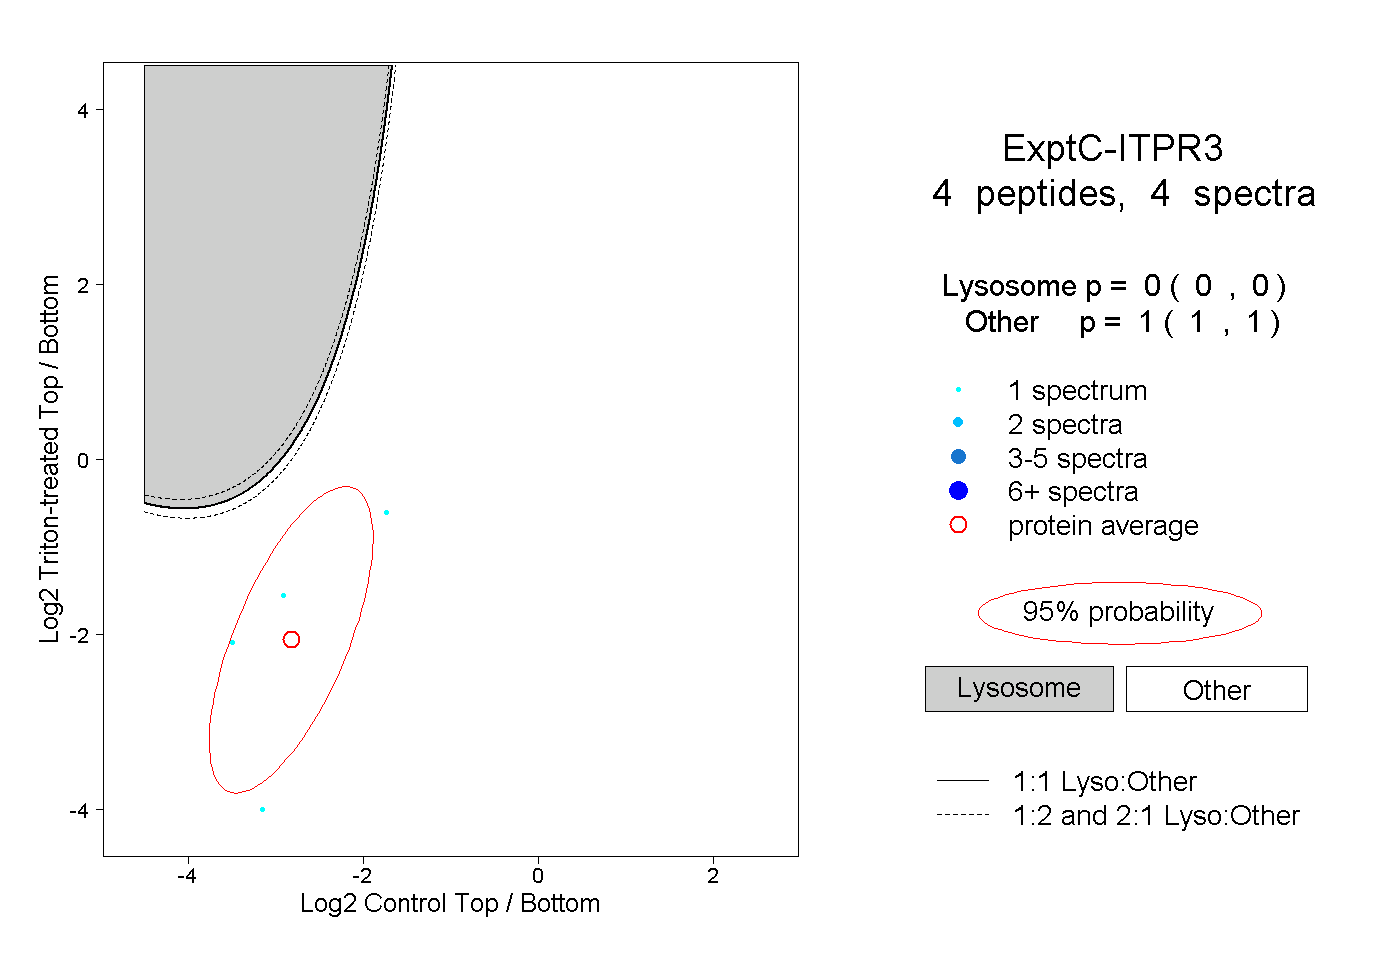
| Plot | Lyso | Other | |||||||||||
| Expt C |
4 peptides |
4 spectra |
|
0.000 0.000 | 0.000 |
1.000 1.000 | 1.000 |
||||||||
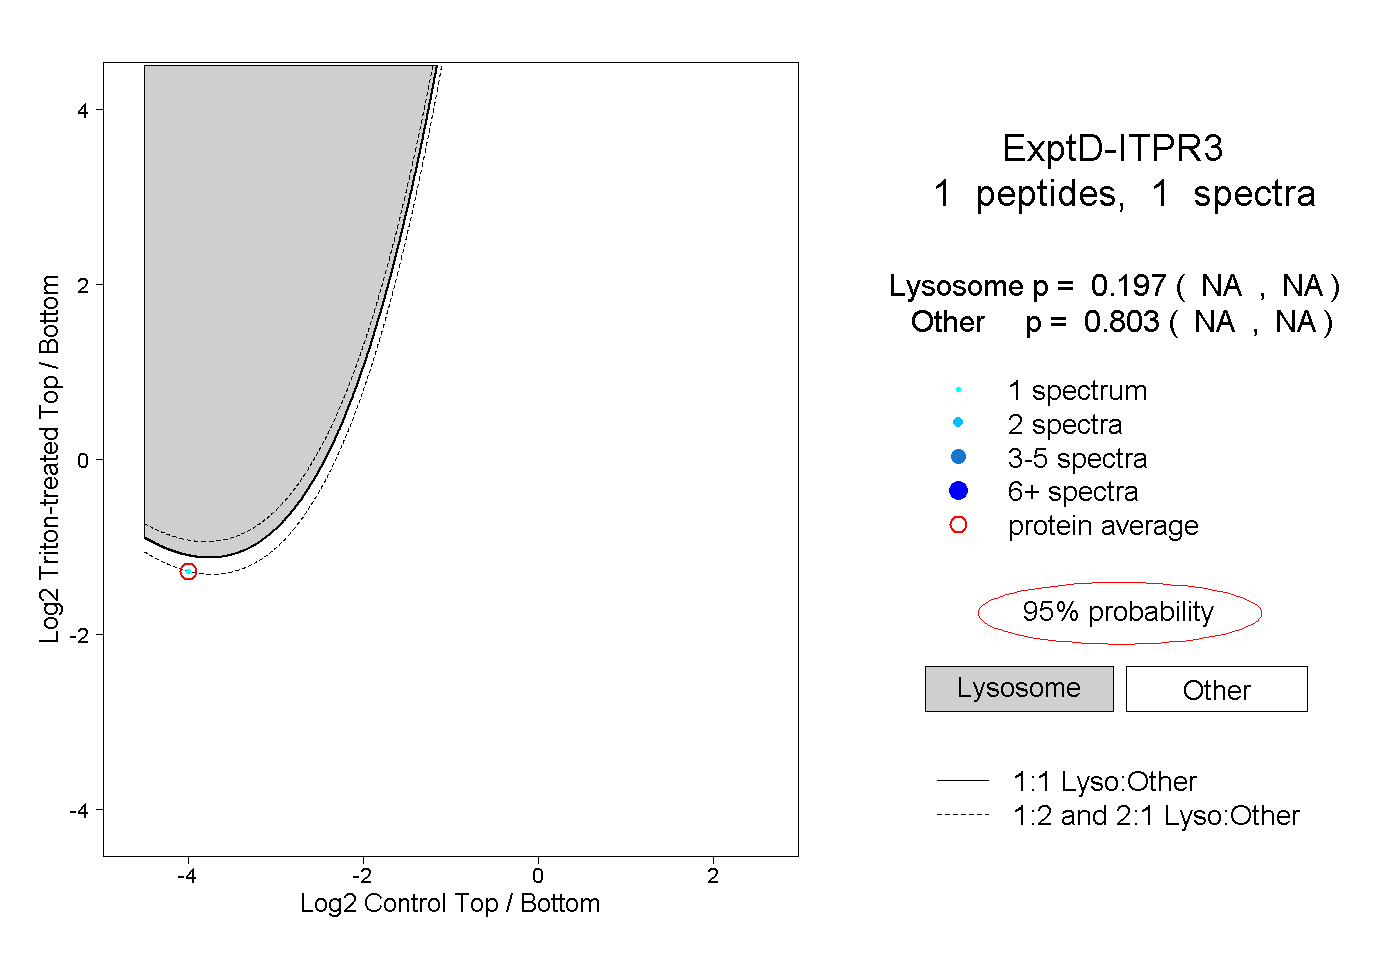
| Plot | Lyso | Other | |||||||||||
| Expt D |
1 peptide |
1 spectrum |
|
0.197 NA | NA |
0.803 NA | NA |