14
14peptides
spectra
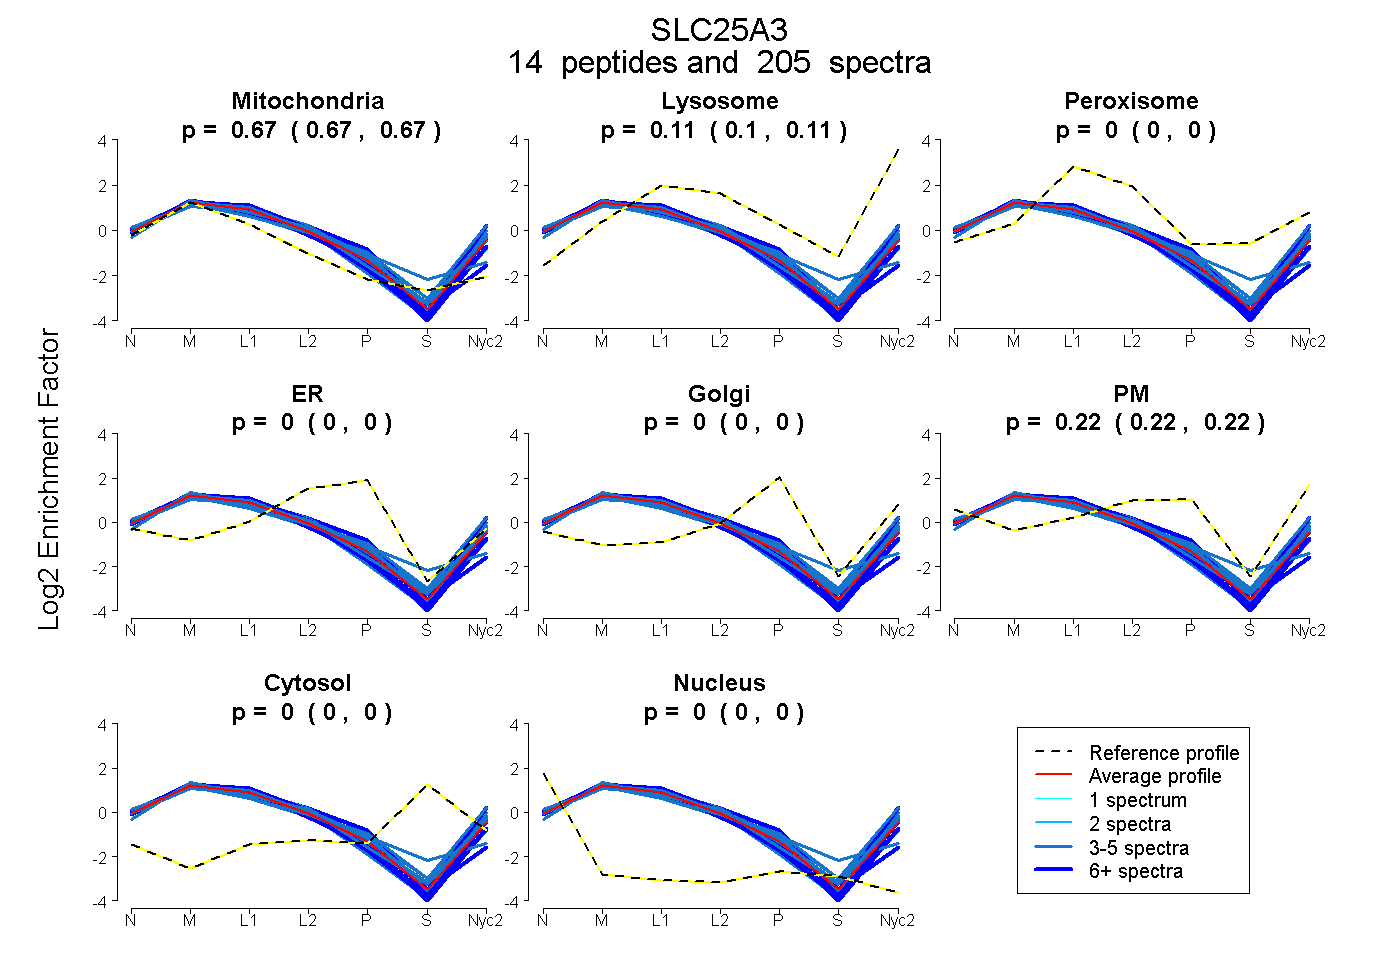
0.670 | 0.675
0.104 | 0.109
0.000 | 0.000
0.000 | 0.000
0.000 | 0.000
0.218 | 0.223
0.000 | 0.000
0.000 | 0.000
12peptides
spectra
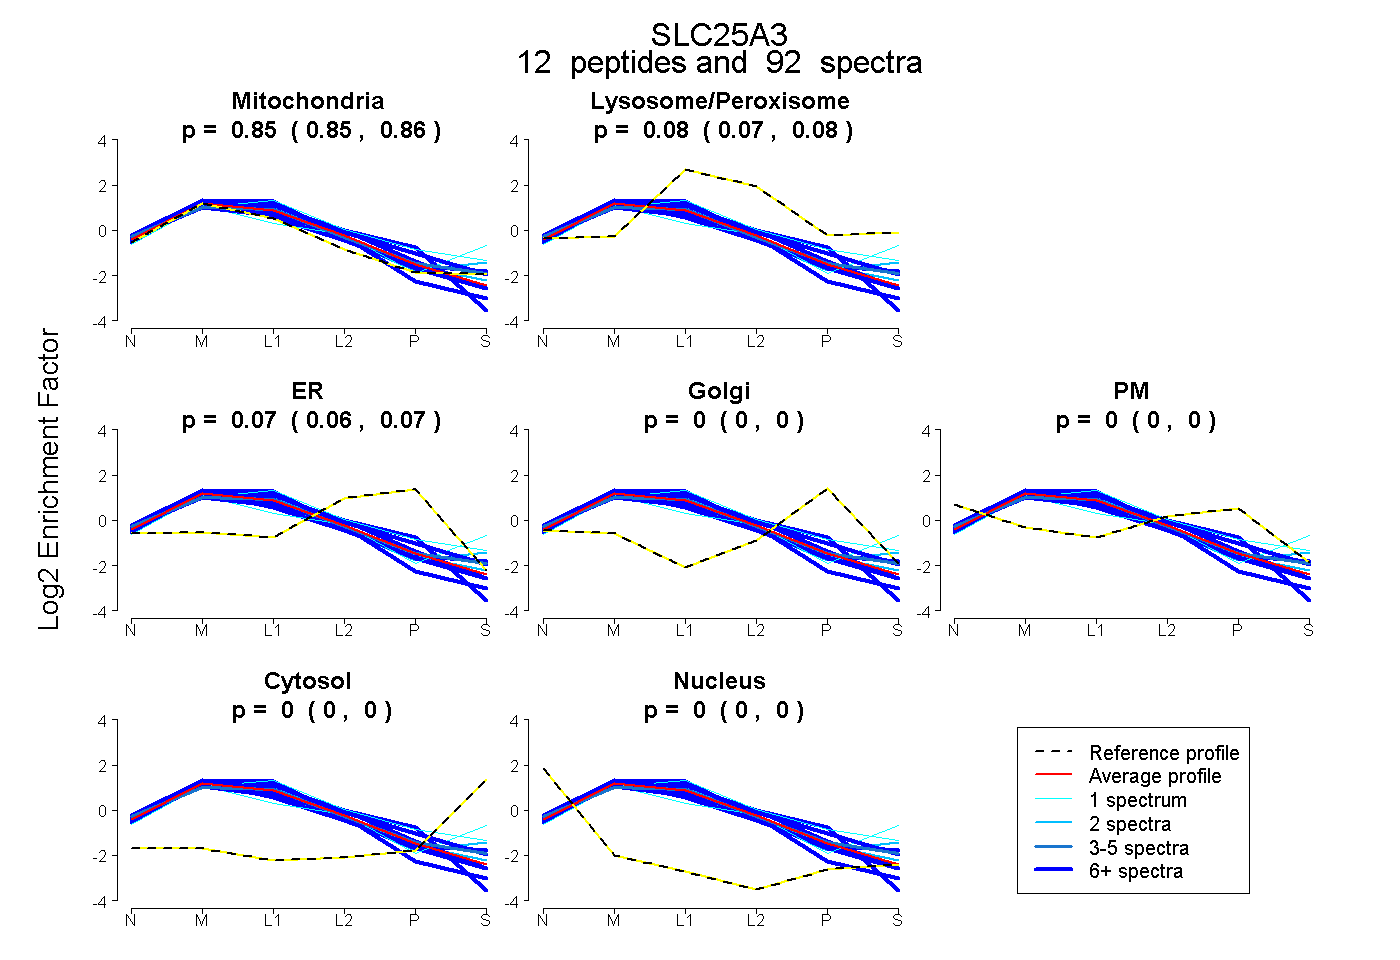
0.849 | 0.859
0.072 | 0.083
0.061 | 0.073
0.000 | 0.000
0.000 | 0.000
0.000 | 0.000
0.000 | 0.000
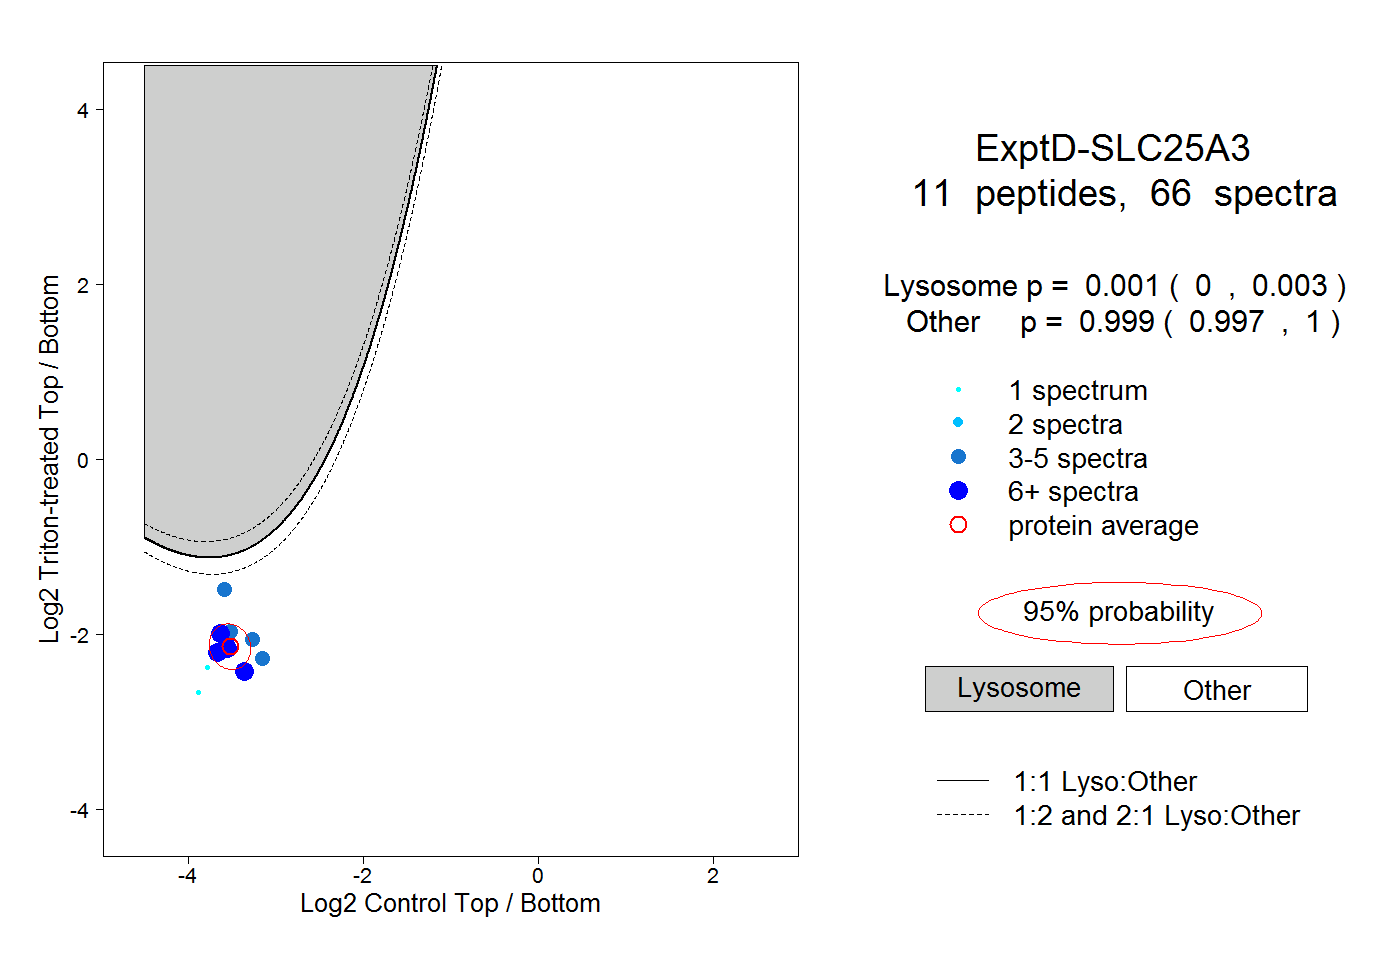
14peptides
spectra
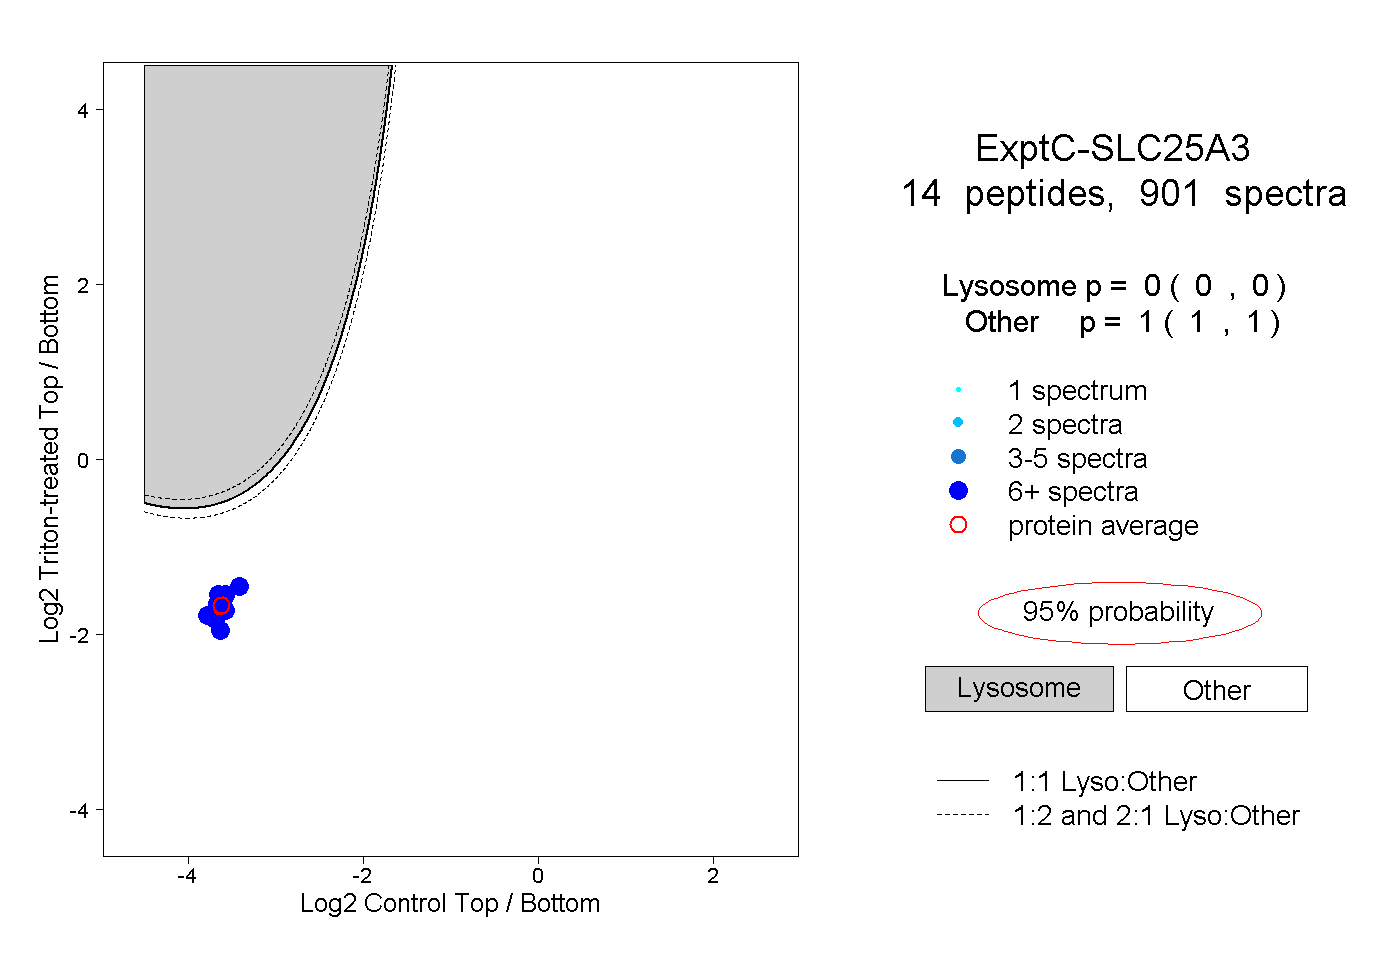
0.000 | 0.000
1.000 | 1.000