 14
14peptides
spectra
0.670 | 0.675
0.104 | 0.109
0.000 | 0.000
0.000 | 0.000
0.000 | 0.000
0.218 | 0.223
0.000 | 0.000
0.000 | 0.000
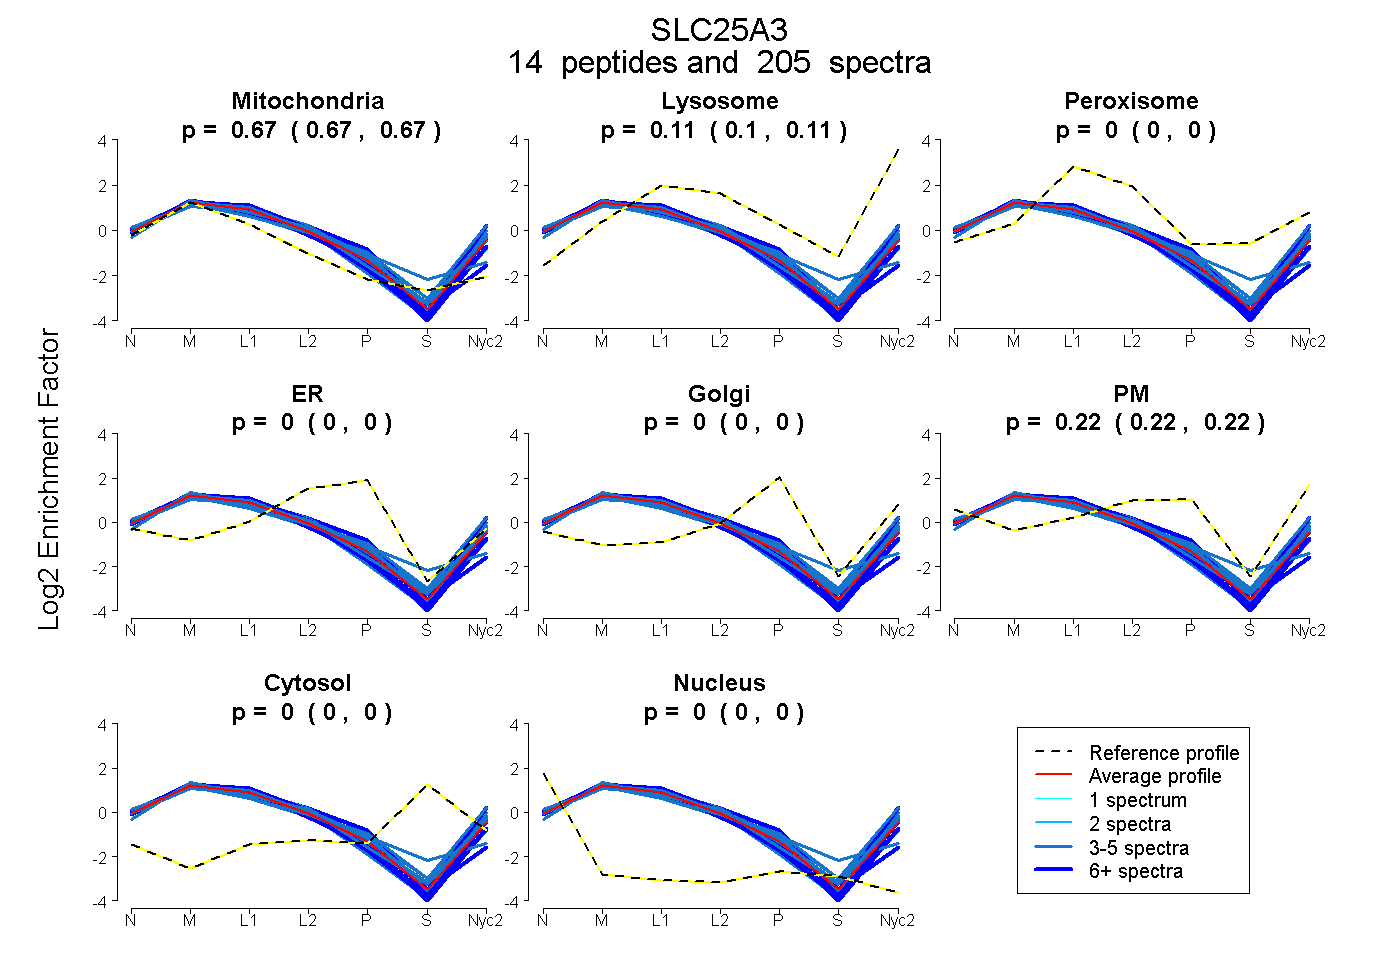
| Plot | Mito | Lyso | Perox | ER | Golgi | PM | Cytosol | Nucleus | |||||
| Expt A |
14 peptides |
205 spectra |
|
0.672 0.670 | 0.675 |
0.107 0.104 | 0.109 |
0.000 0.000 | 0.000 |
0.000 0.000 | 0.000 |
0.000 0.000 | 0.000 |
0.221 0.218 | 0.223 |
0.000 0.000 | 0.000 |
0.000 0.000 | 0.000 |
| 4 spectra, TVEALYK | 0.634 | 0.099 | 0.000 | 0.000 | 0.000 | 0.266 | 0.000 | 0.000 | ||
| 3 spectra, MQVDPQK | 0.626 | 0.113 | 0.000 | 0.000 | 0.000 | 0.261 | 0.000 | 0.000 | ||
| 4 spectra, GWAPTLIGYSMQGLCK | 0.649 | 0.000 | 0.206 | 0.145 | 0.000 | 0.000 | 0.000 | 0.000 | ||
| 5 spectra, GIFNGFSITLK | 0.630 | 0.179 | 0.002 | 0.000 | 0.000 | 0.189 | 0.000 | 0.000 | ||
| 4 spectra, QIPYTMMK | 0.708 | 0.188 | 0.000 | 0.000 | 0.000 | 0.105 | 0.000 | 0.000 | ||
| 22 spectra, FVVPKPR | 0.598 | 0.062 | 0.000 | 0.024 | 0.000 | 0.315 | 0.000 | 0.000 | ||
| 5 spectra, LPRPPPPEMPESLK | 0.552 | 0.168 | 0.000 | 0.000 | 0.000 | 0.281 | 0.000 | 0.000 | ||
| 37 spectra, GVAPLWMR | 0.587 | 0.204 | 0.000 | 0.000 | 0.000 | 0.209 | 0.000 | 0.000 | ||
| 12 spectra, FACFER | 0.781 | 0.000 | 0.021 | 0.165 | 0.000 | 0.033 | 0.000 | 0.000 | ||
| 56 spectra, GSTASQVLQR | 0.694 | 0.124 | 0.000 | 0.000 | 0.000 | 0.182 | 0.000 | 0.000 | ||
| 39 spectra, IQTQPGYANTLR | 0.717 | 0.121 | 0.000 | 0.000 | 0.000 | 0.162 | 0.000 | 0.000 | ||
| 4 spectra, ALYSNILGEENTYLWR | 0.772 | 0.065 | 0.000 | 0.000 | 0.000 | 0.163 | 0.000 | 0.000 | ||
| 3 spectra, EEGLNAFYK | 0.612 | 0.151 | 0.000 | 0.000 | 0.000 | 0.237 | 0.000 | 0.000 | ||
| 7 spectra, FGFYEVFK | 0.722 | 0.030 | 0.000 | 0.000 | 0.000 | 0.248 | 0.000 | 0.000 |
| Plot | Mito | Lyso or Perox | ER | Golgi | PM | Cytosol | Nucleus | ||||||
| Expt B |
12 peptides |
92 spectra |
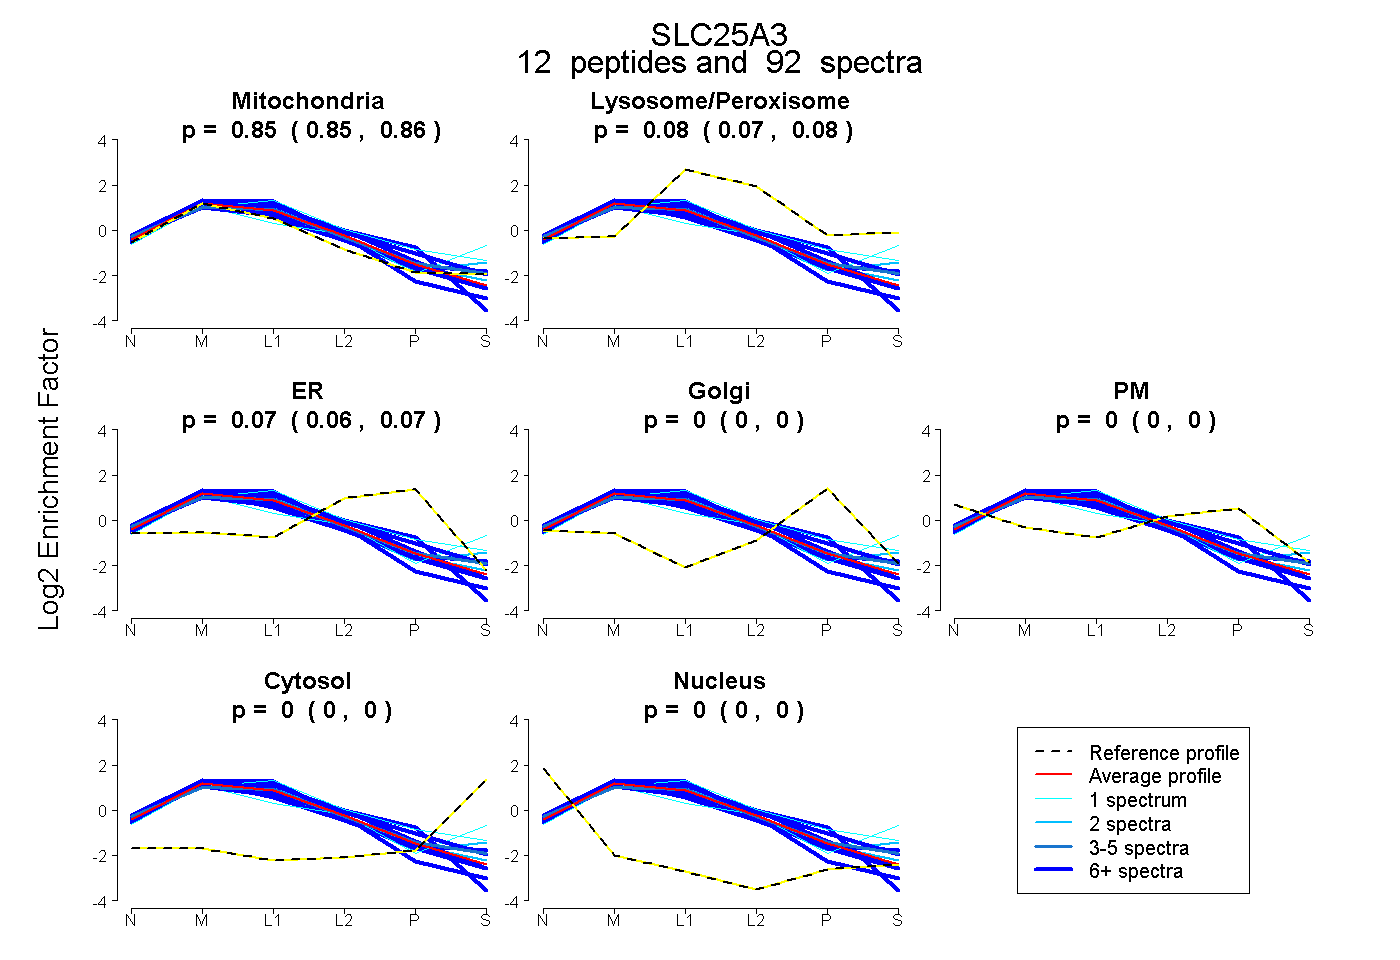 |
0.854 0.849 | 0.859 |
0.078 0.072 | 0.083 |
0.068 0.061 | 0.073 |
0.000 0.000 | 0.000 |
0.000 0.000 | 0.000 |
0.000 0.000 | 0.000 |
0.000 0.000 | 0.000 |
|||
| Plot | Lyso | Other | |||||||||||
| Expt C |
14 peptides |
901 spectra |
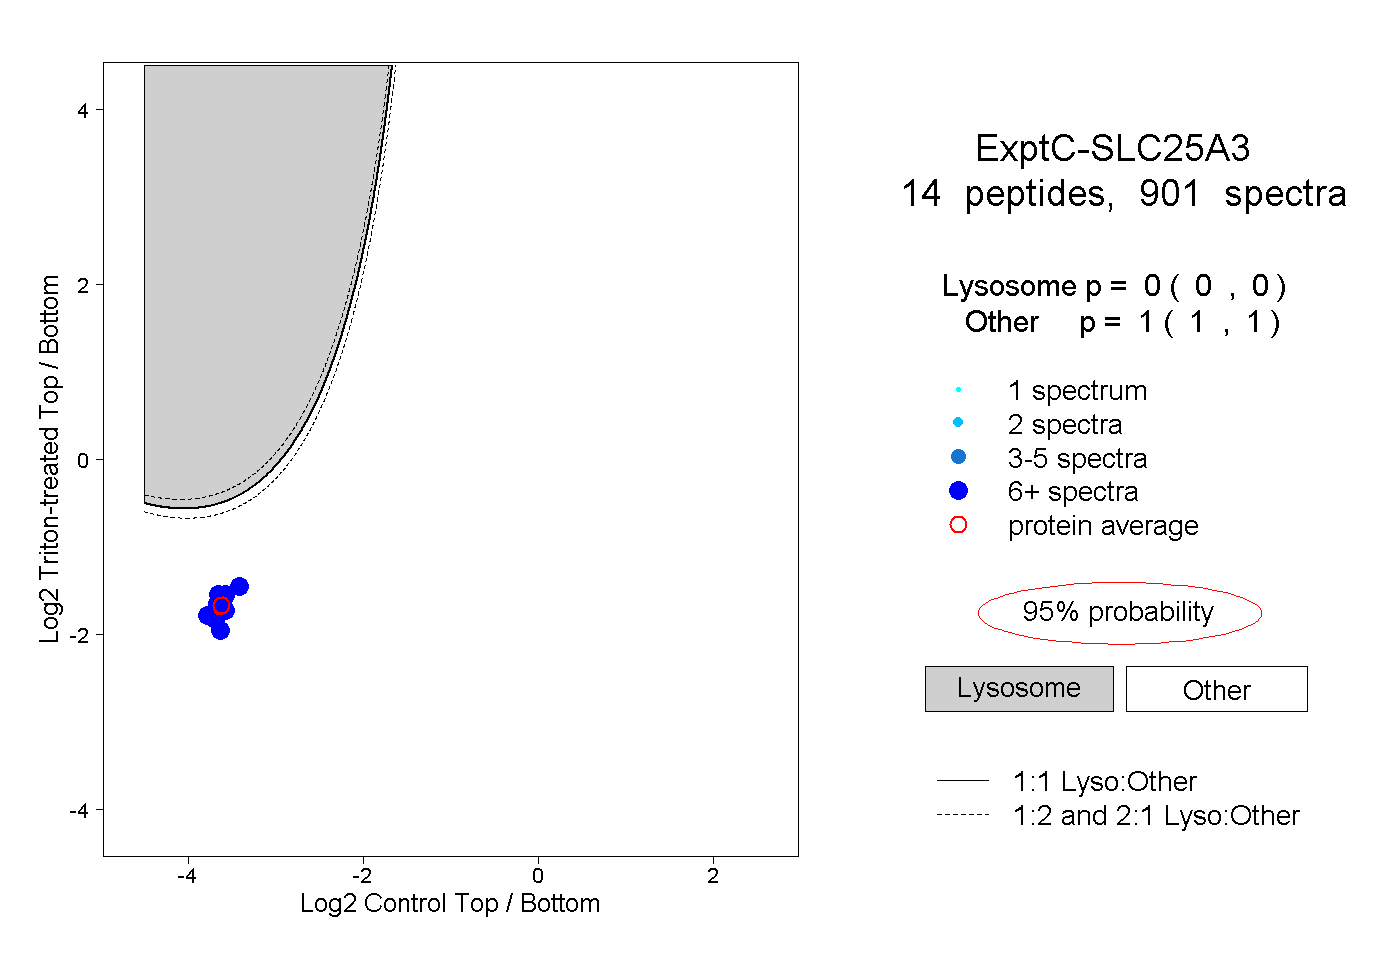 |
0.000 0.000 | 0.000 |
1.000 1.000 | 1.000 |
||||||||
| Plot | Lyso | Other | |||||||||||
| Expt D |
11 peptides |
66 spectra |
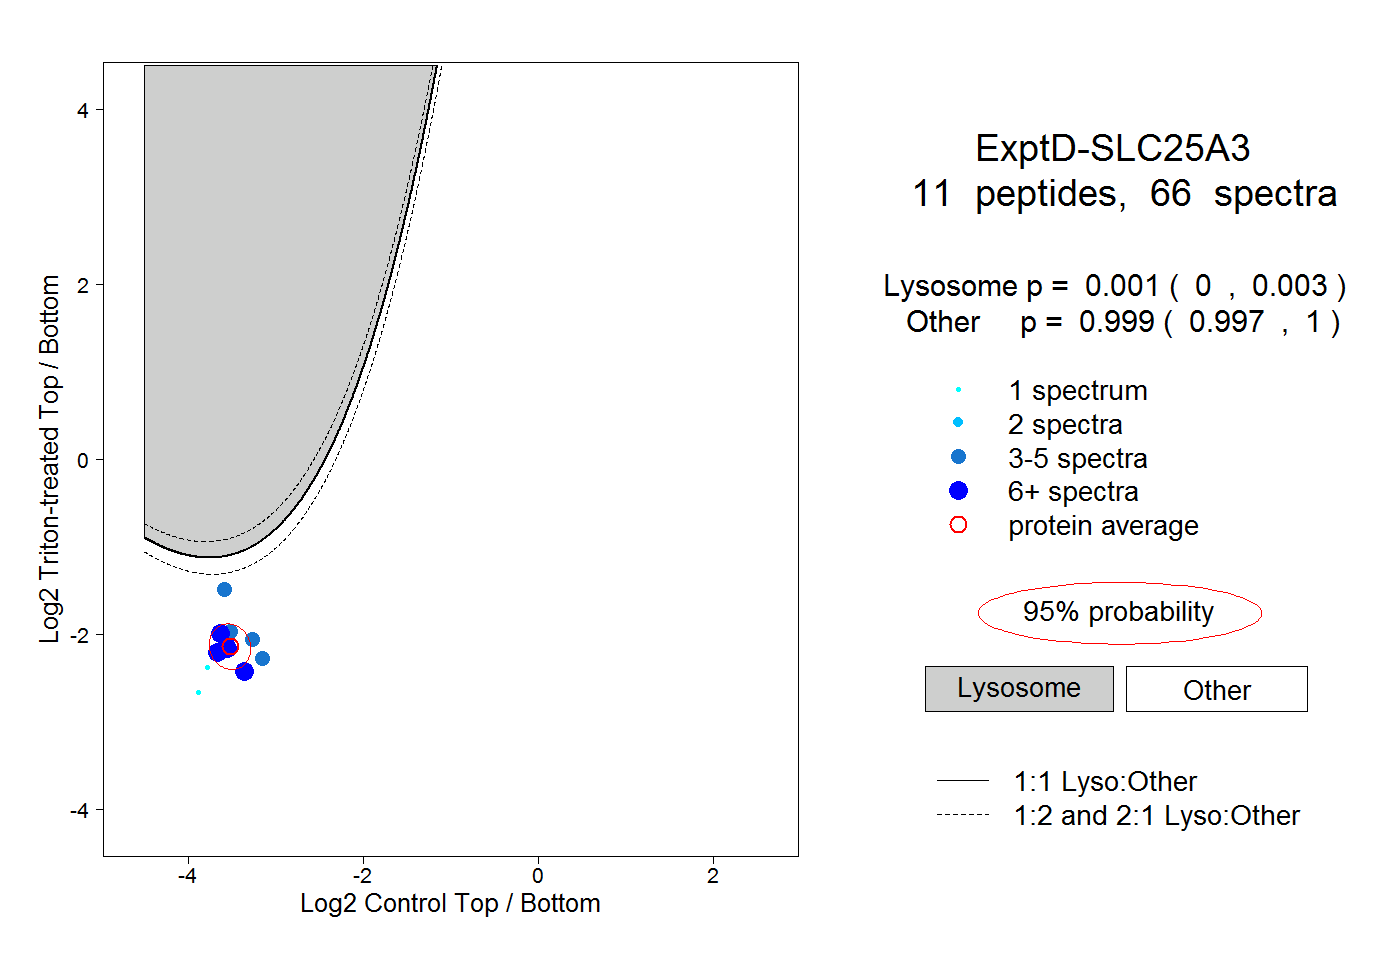 |
0.001 0.000 | 0.003 |
0.999 0.997 | 1.000 |