 4
4peptides
spectra
0.634 | 0.692
0.000 | 0.050
0.022 | 0.138
0.000 | 0.000
0.000 | 0.000
0.180 | 0.263
0.000 | 0.000
0.000 | 0.000
| Plot | Mito | Lyso | Perox | ER | Golgi | PM | Cytosol | Nucleus | |||||
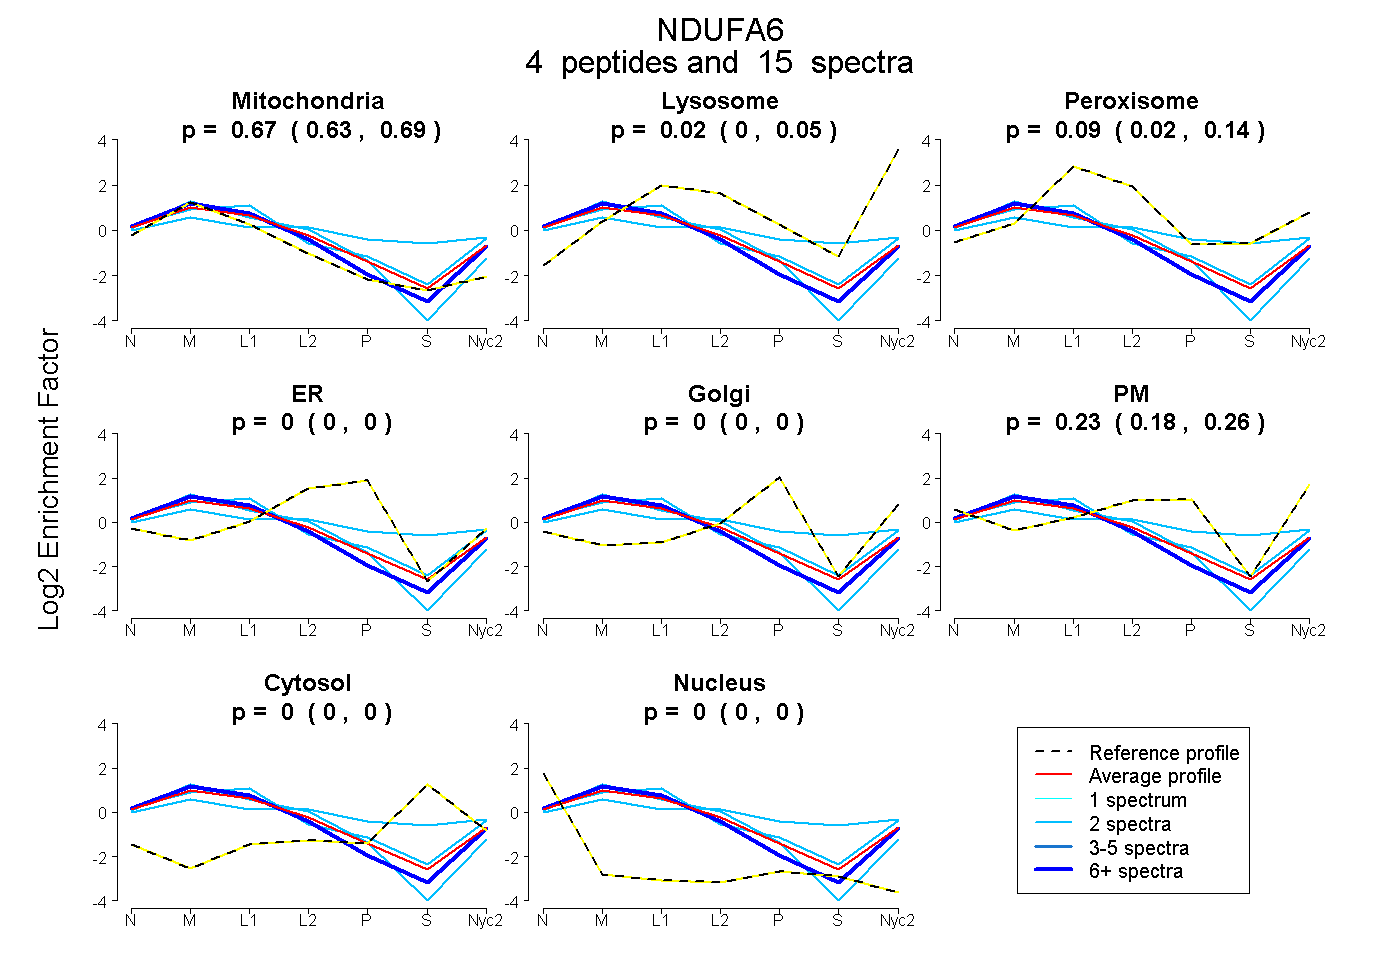
| Expt A |
4 peptides |
15 spectra |
|
0.665 0.634 | 0.692 |
0.023 0.000 | 0.050 |
0.086 0.022 | 0.138 |
0.000 0.000 | 0.000 |
0.000 0.000 | 0.000 |
0.226 0.180 | 0.263 |
0.000 0.000 | 0.000 |
0.000 0.000 | 0.000 |
| 2 spectra, QAASAASTSVKPIFSR | 0.746 | 0.000 | 0.000 | 0.097 | 0.000 | 0.157 | 0.000 | 0.000 | ||
| 9 spectra, VVDLLVIK | 0.778 | 0.092 | 0.000 | 0.000 | 0.000 | 0.130 | 0.000 | 0.000 | ||
| 2 spectra, FYIGHDP | 0.299 | 0.000 | 0.231 | 0.000 | 0.006 | 0.251 | 0.212 | 0.000 | ||
| 2 spectra, FFHETETPRPK | 0.614 | 0.067 | 0.107 | 0.000 | 0.000 | 0.212 | 0.000 | 0.000 |
| Plot | Mito | Lyso or Perox | ER | Golgi | PM | Cytosol | Nucleus | ||||||
| Expt B |
3 peptides |
9 spectra |
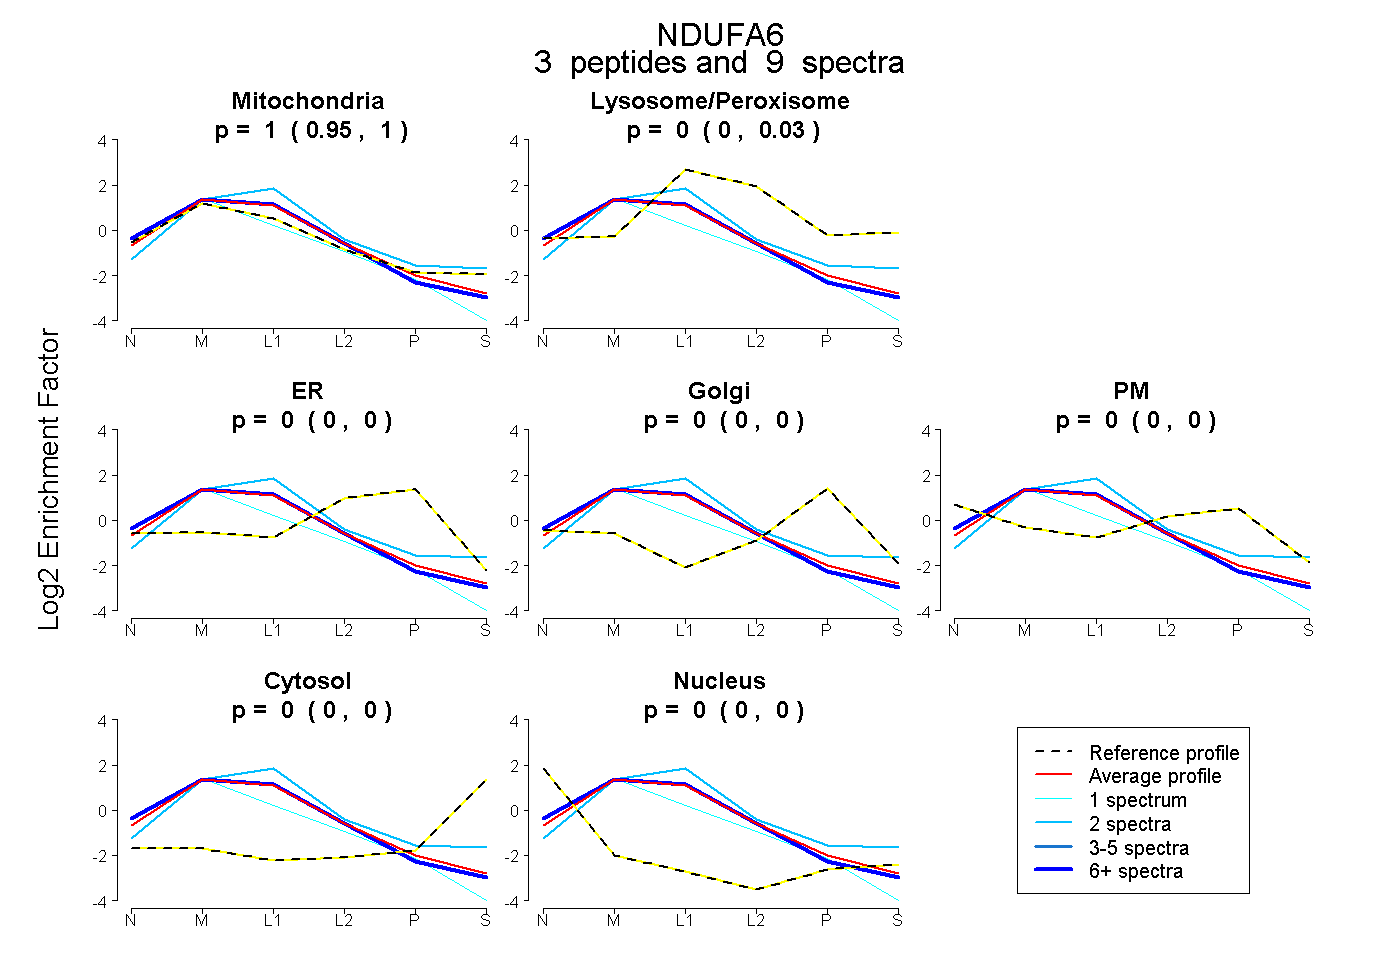 |
1.000 0.955 | 1.000 |
0.000 0.000 | 0.031 |
0.000 0.000 | 0.000 |
0.000 0.000 | 0.000 |
0.000 0.000 | 0.000 |
0.000 0.000 | 0.000 |
0.000 0.000 | 0.000 |
|||
| Plot | Lyso | Other | |||||||||||
| Expt C |
6 peptides |
67 spectra |
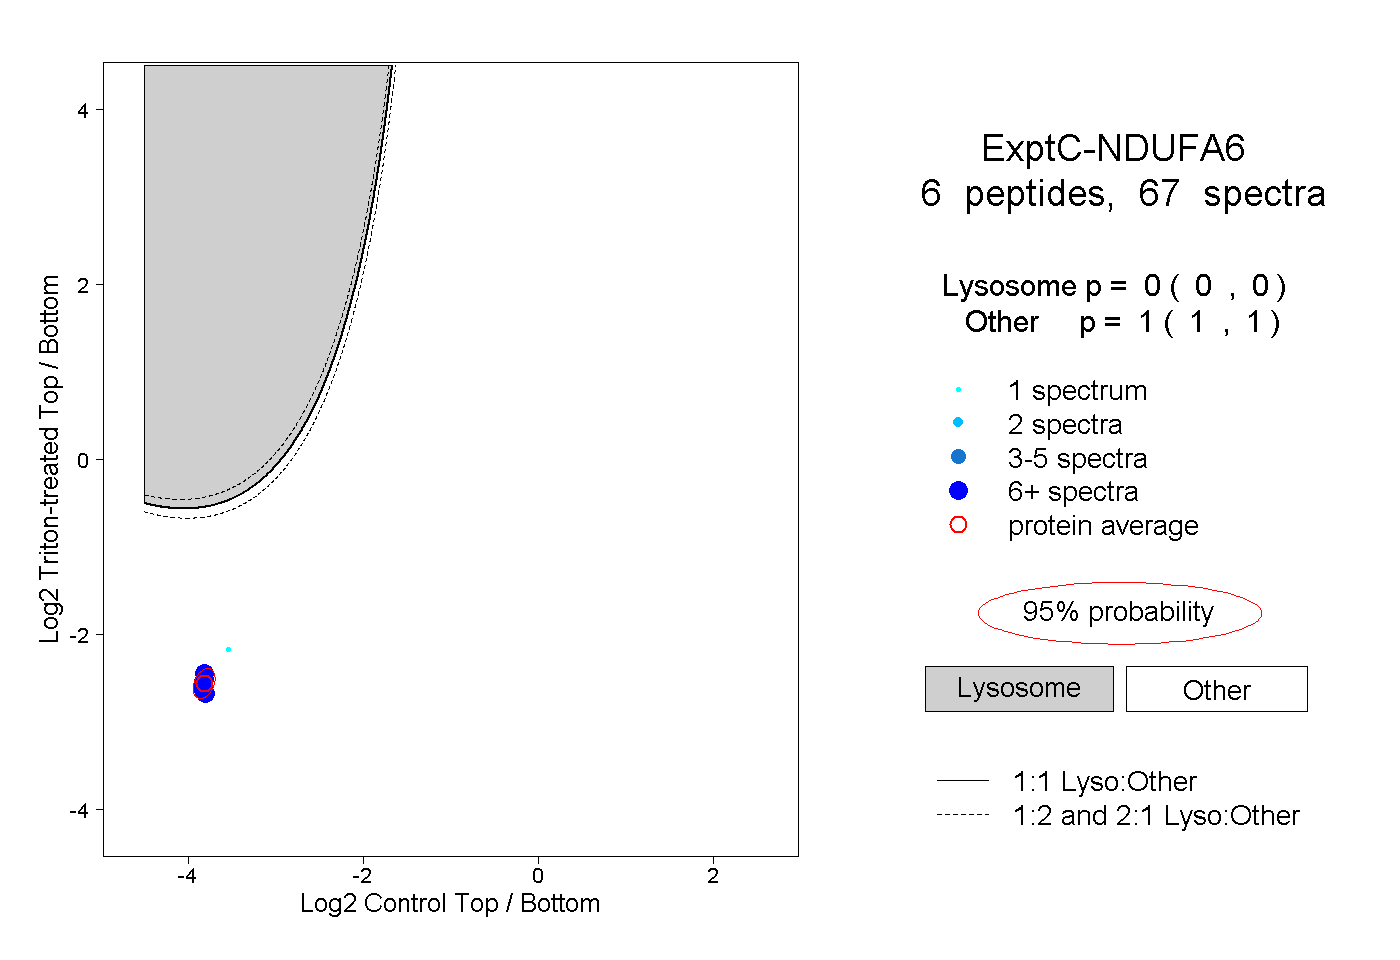 |
0.000 0.000 | 0.000 |
1.000 1.000 | 1.000 |
||||||||
| Plot | Lyso | Other | |||||||||||
| Expt D |
1 peptide |
1 spectrum |
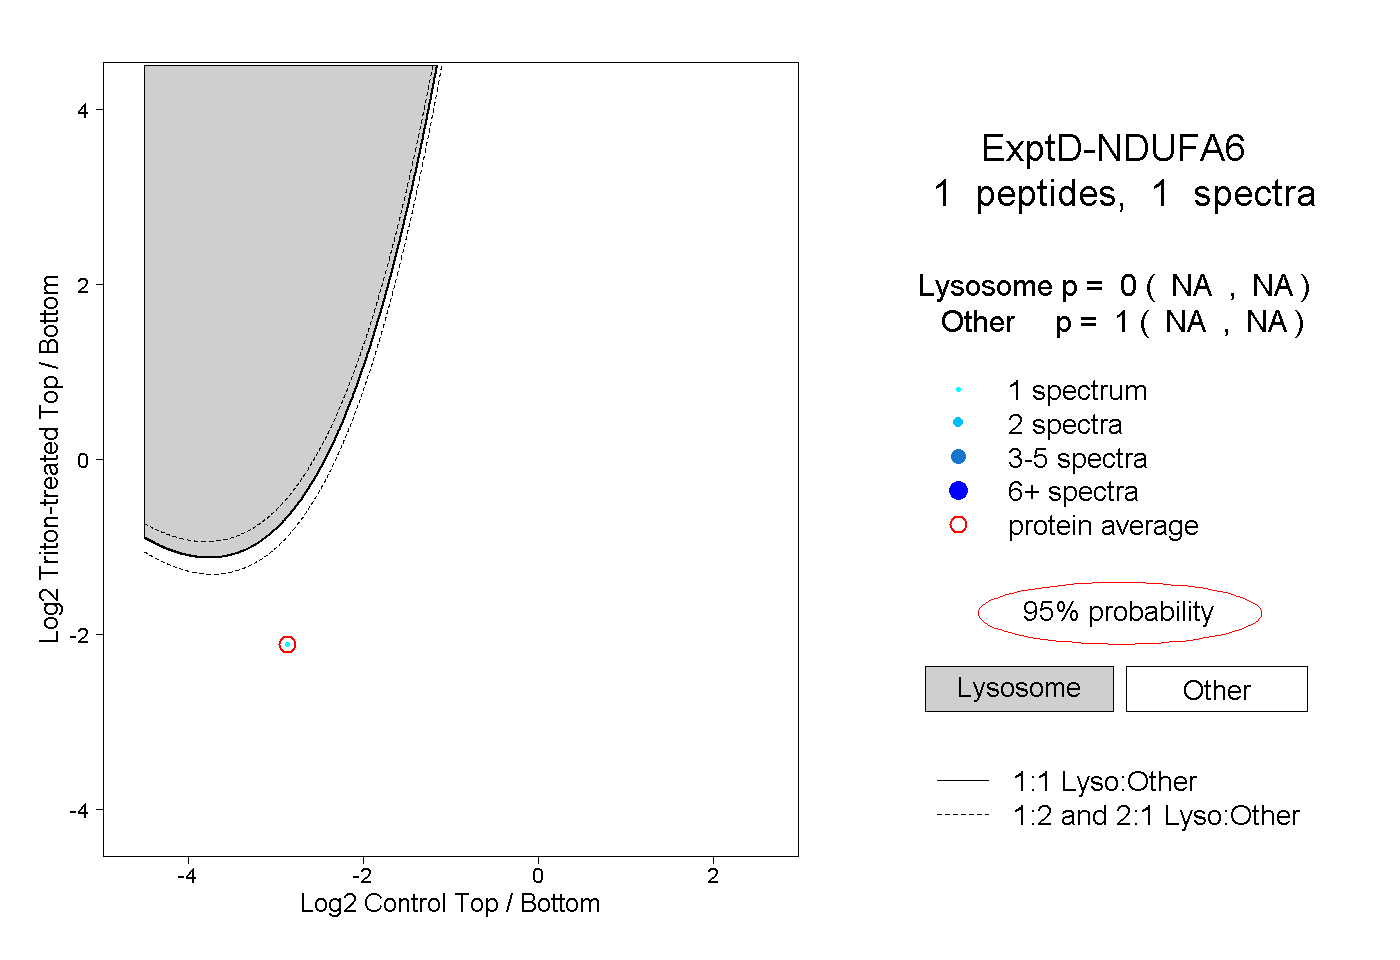 |
0.000 NA | NA |
1.000 NA | NA |