 2
2peptides
spectra
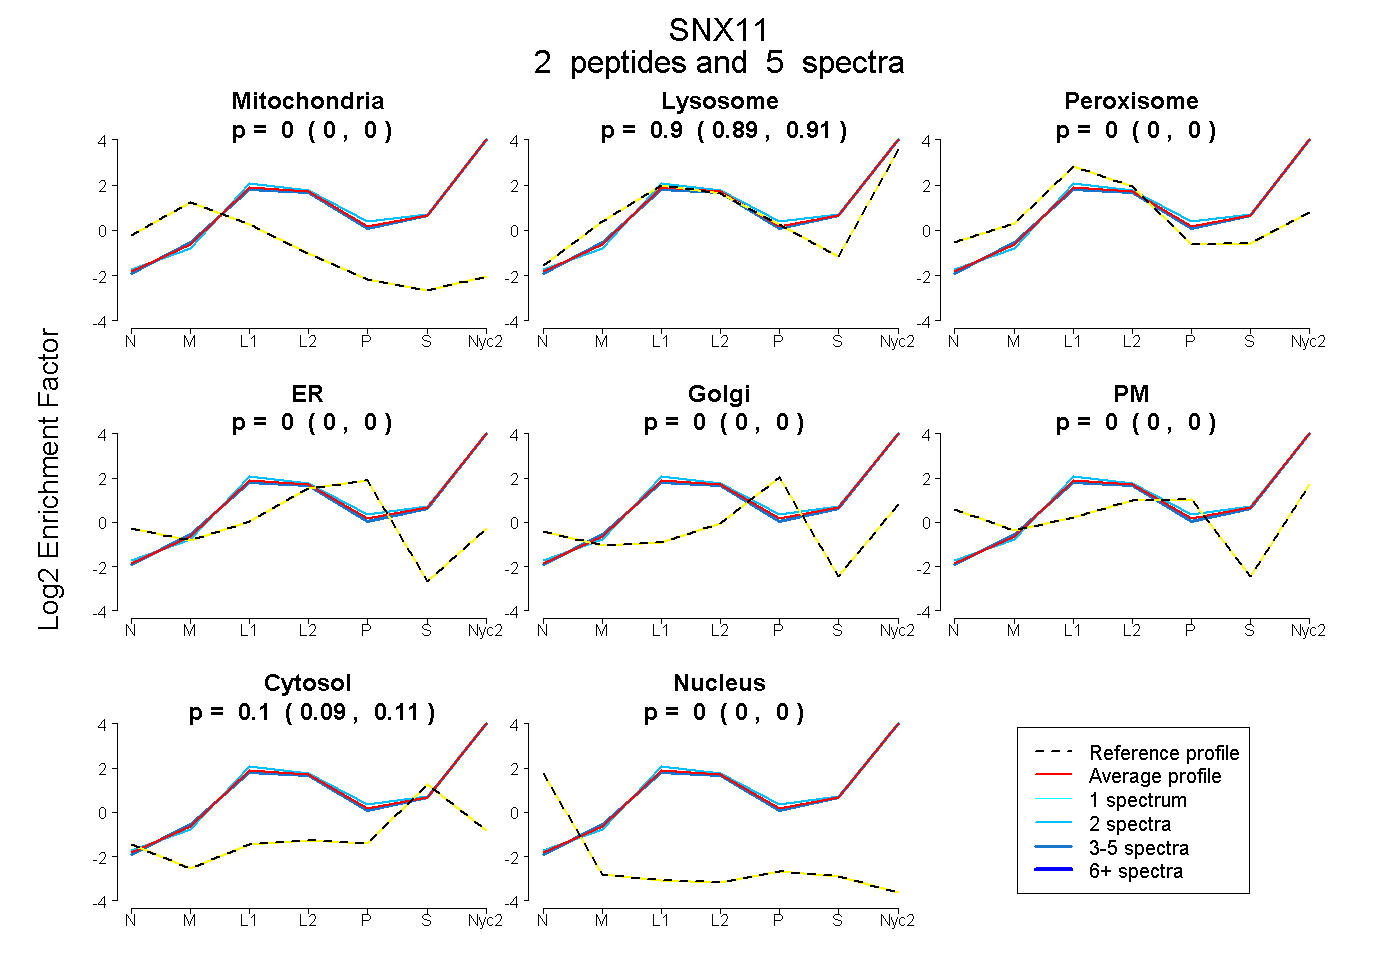
0.000 | 0.000
0.888 | 0.910
0.000 | 0.000
0.000 | 0.000
0.000 | 0.000
0.000 | 0.000
0.088 | 0.110
0.000 | 0.000
1peptide
spectrum
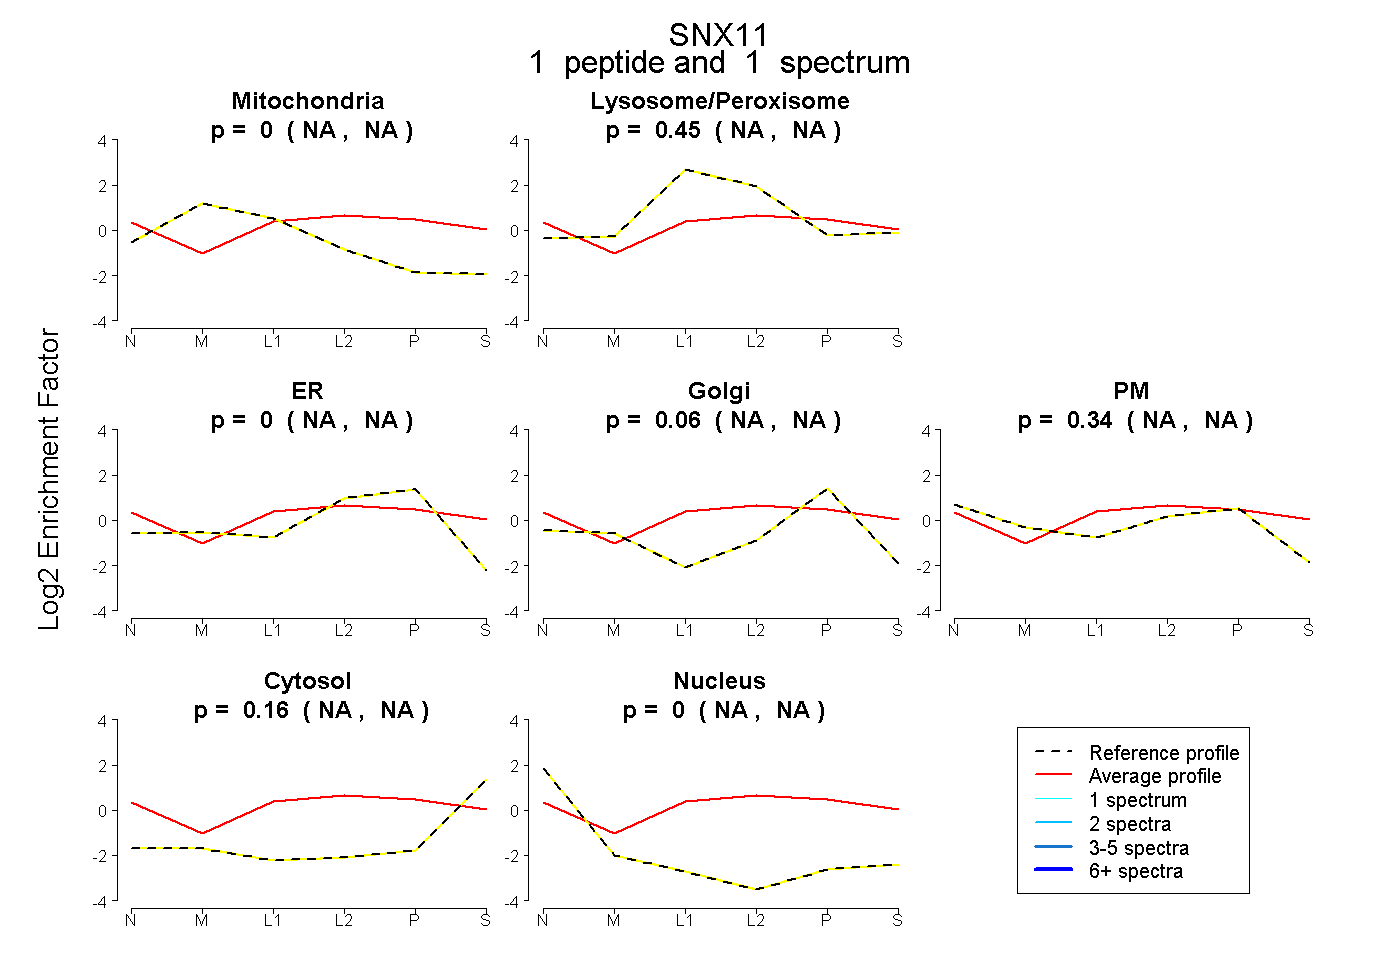
NA | NA
NA | NA
NA | NA
NA | NA
NA | NA
NA | NA
NA | NA
3peptides
spectra
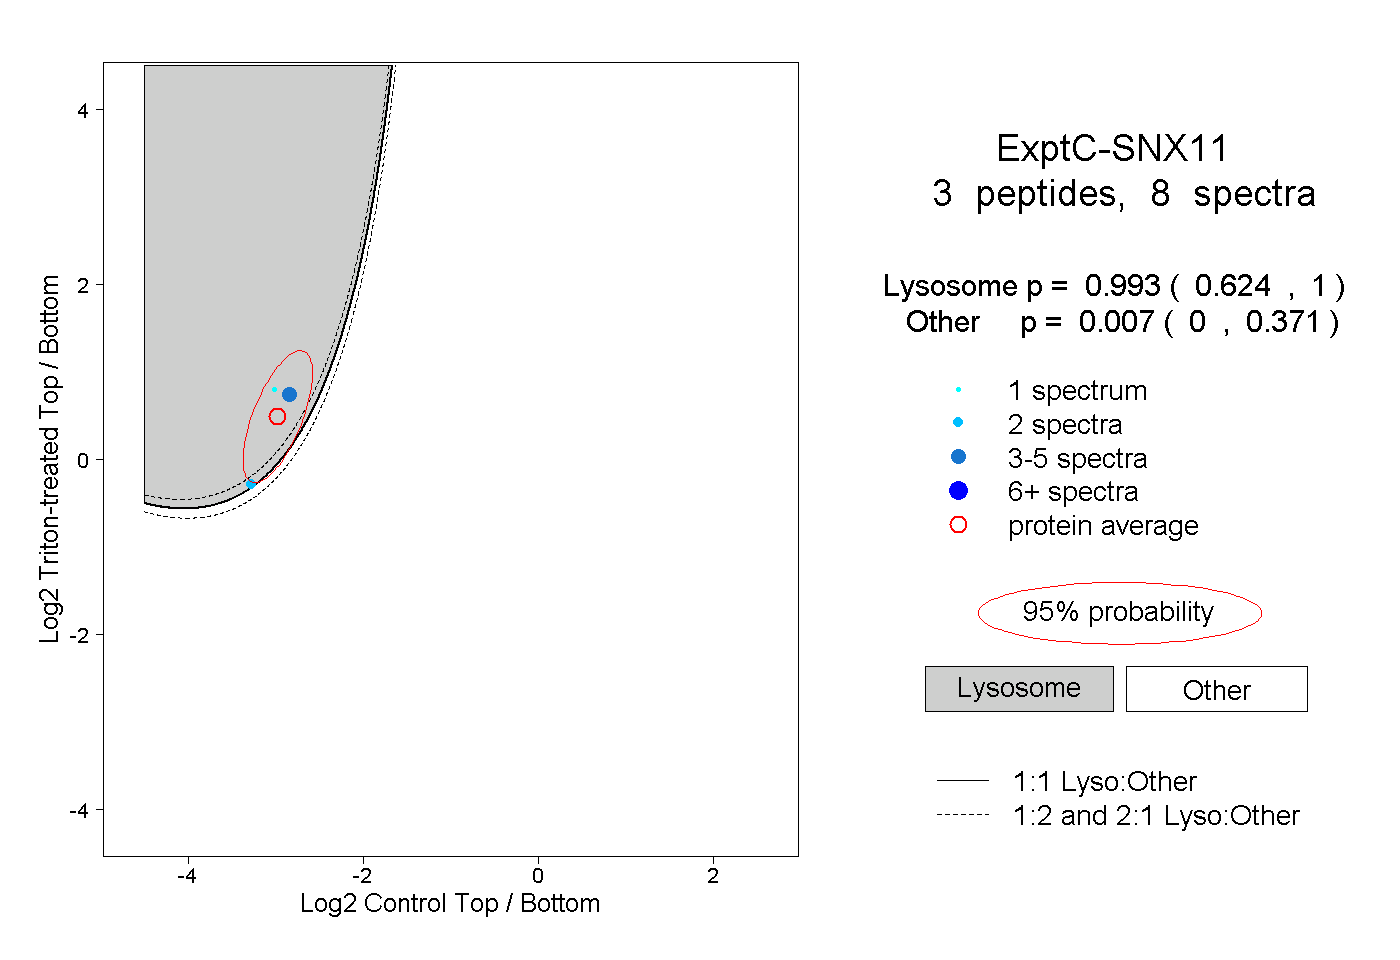
0.624 | 1.000
0.000 | 0.371
1peptide
spectra
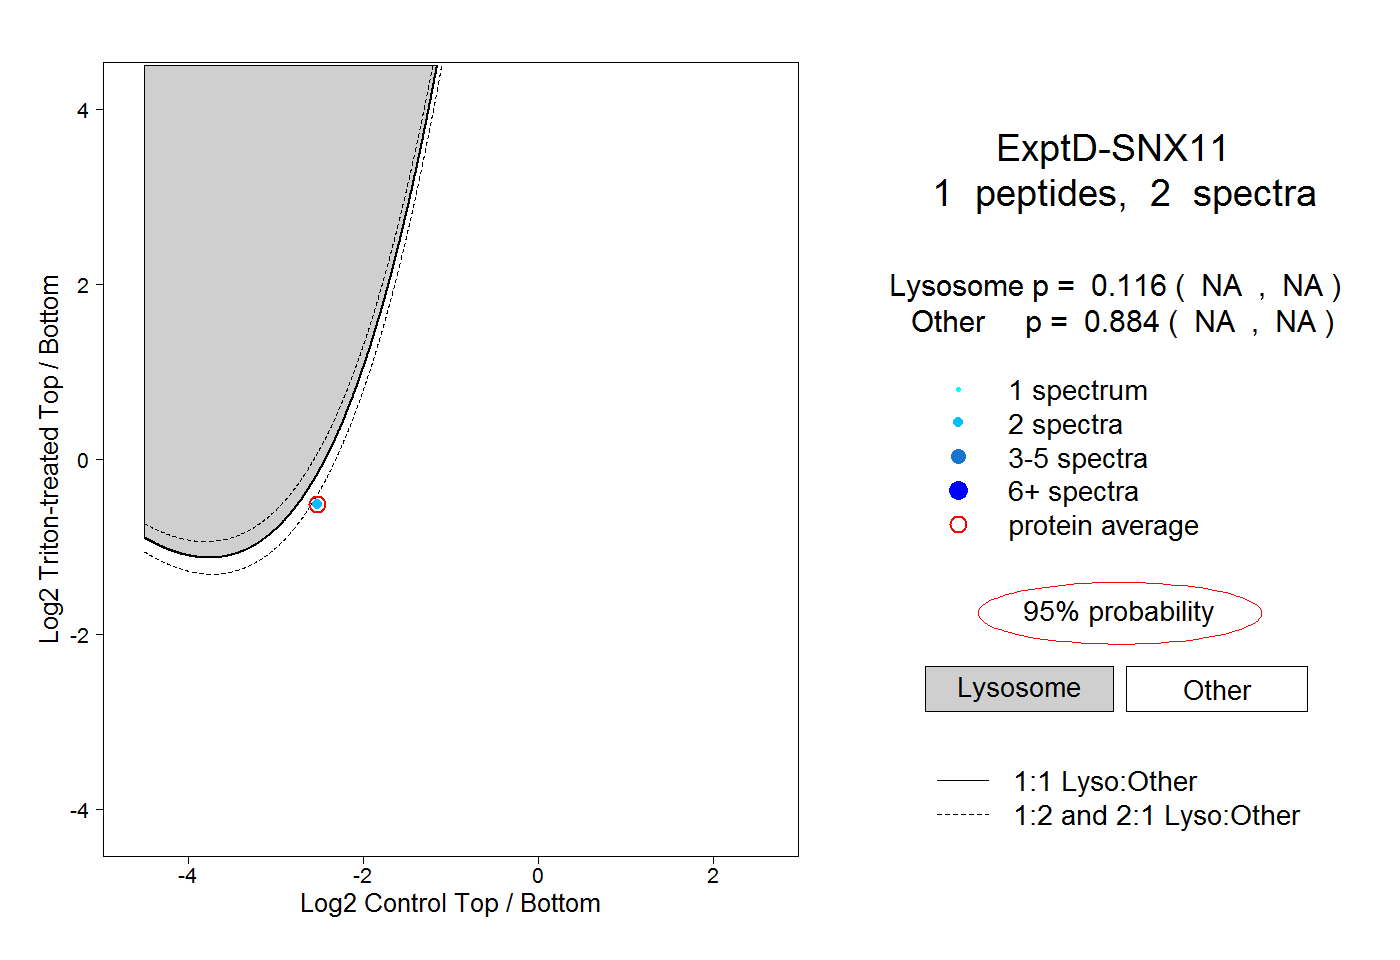
NA | NA
NA | NA