 18
18peptides
spectra
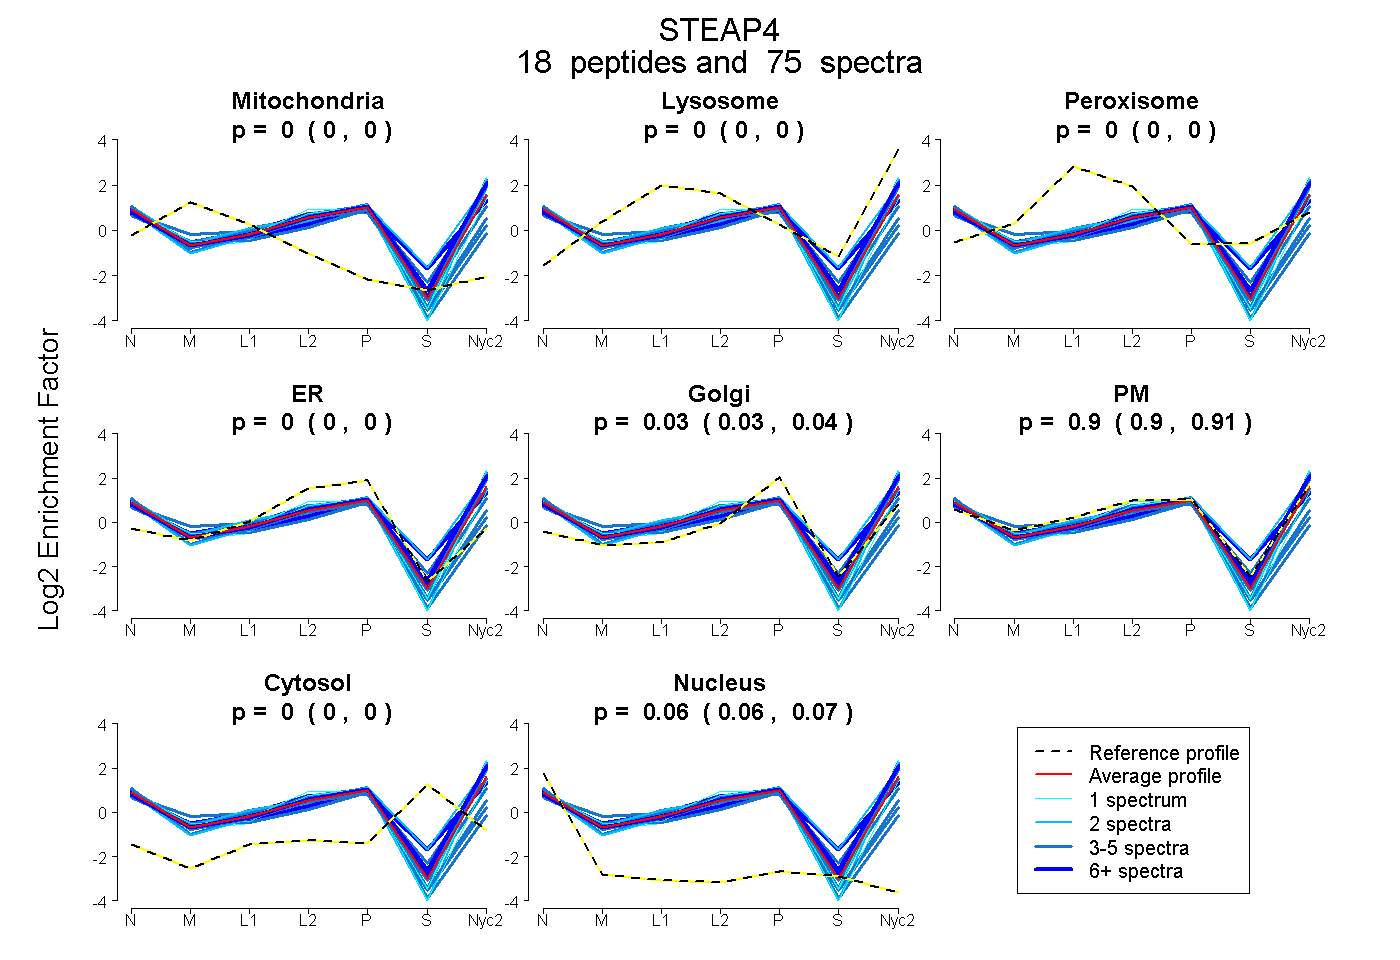
0.000 | 0.000
0.000 | 0.000
0.000 | 0.000
0.000 | 0.000
0.028 | 0.036
0.898 | 0.908
0.000 | 0.000
0.061 | 0.066
8peptides
spectra
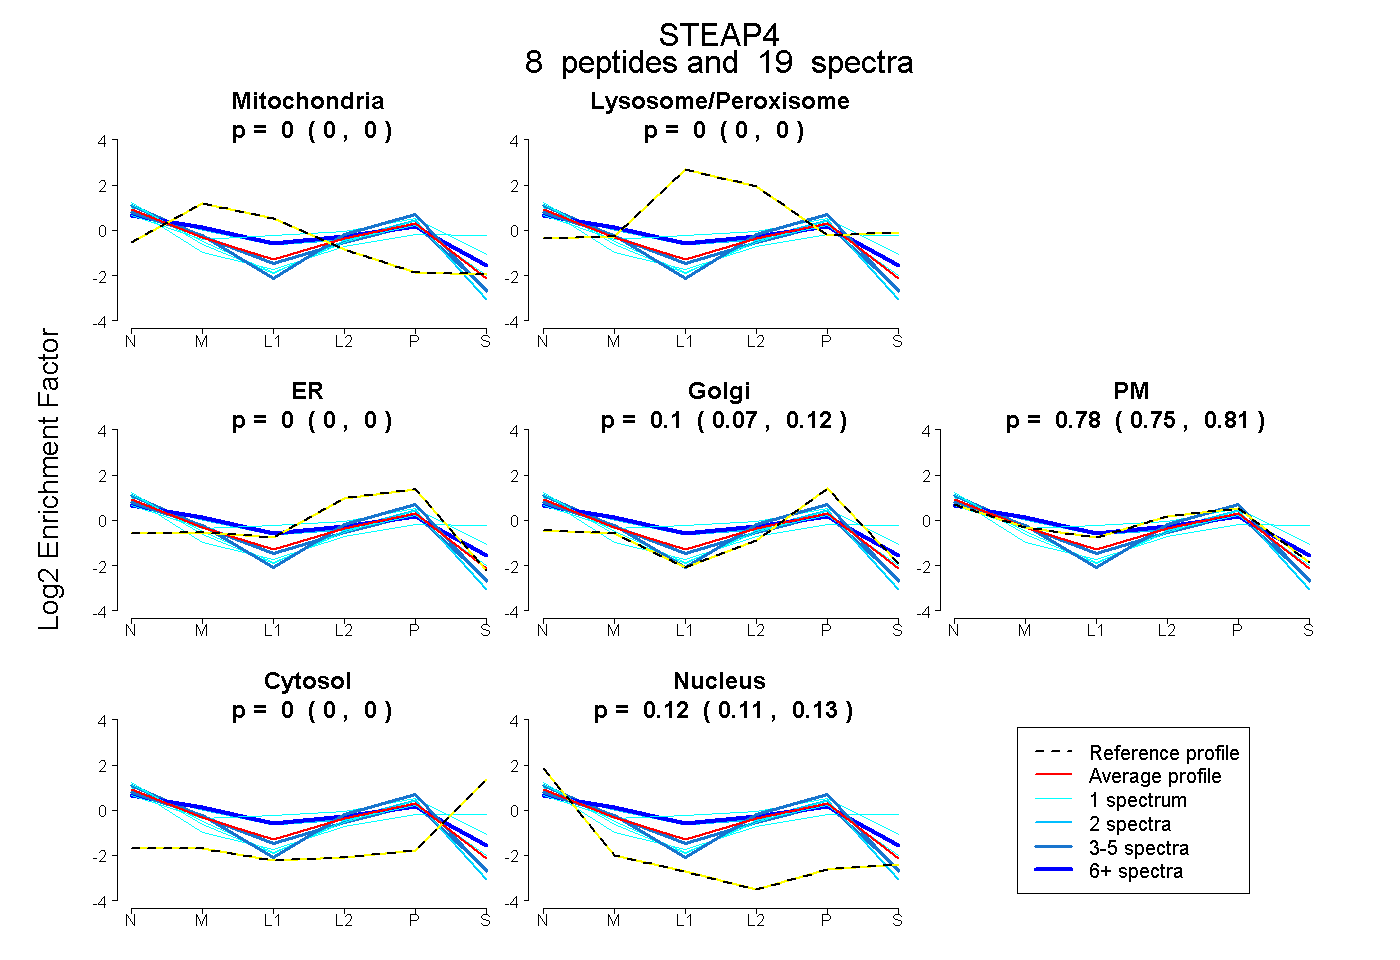
0.000 | 0.000
0.000 | 0.000
0.000 | 0.000
0.071 | 0.124
0.748 | 0.810
0.000 | 0.000
0.110 | 0.125
14peptides
spectra
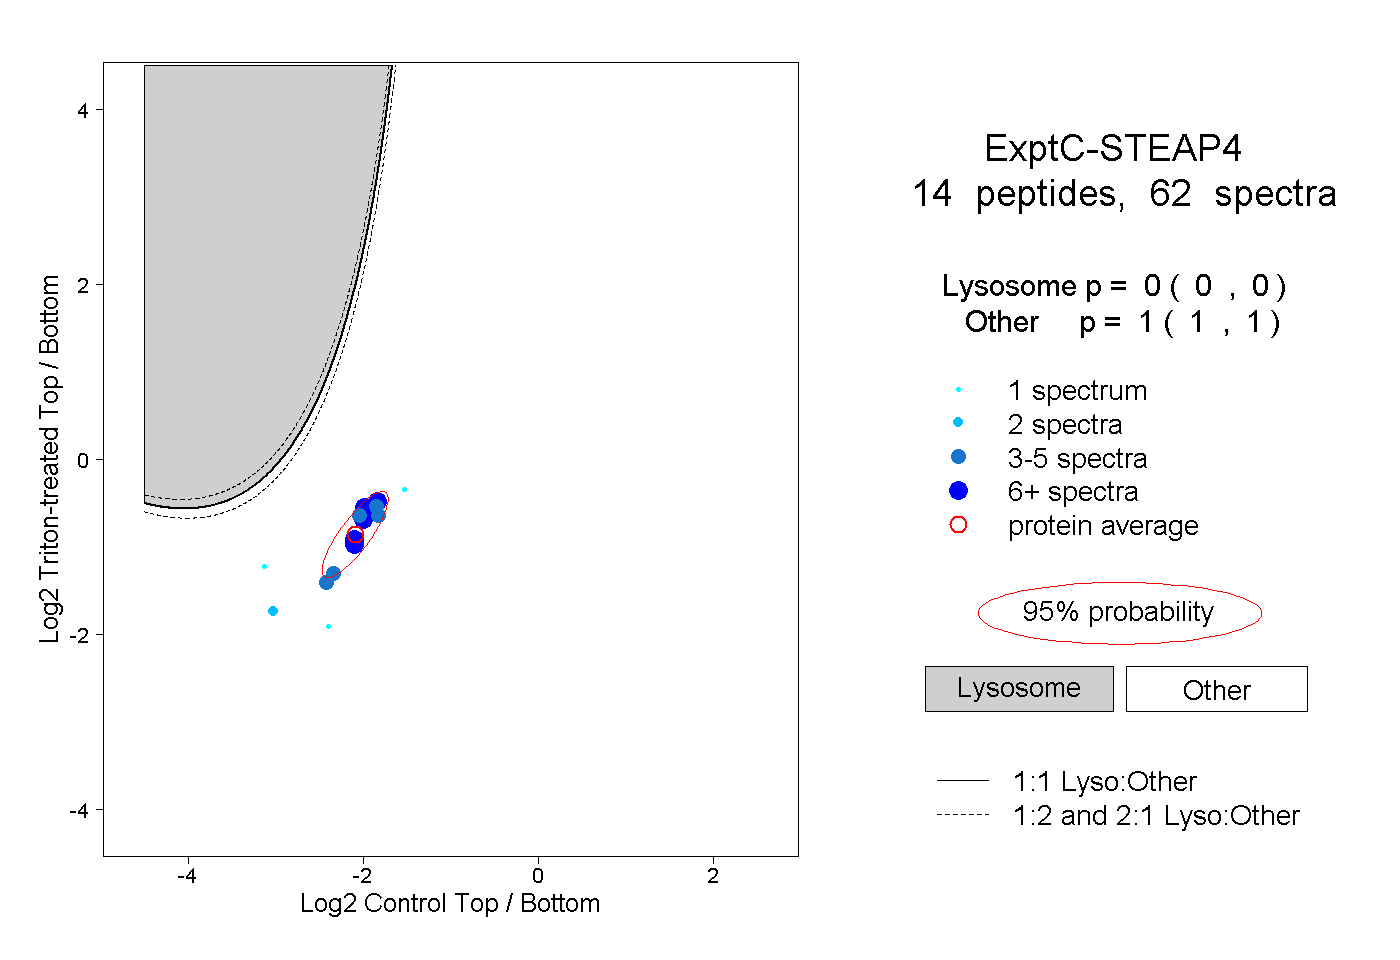
0.000 | 0.000
1.000 | 1.000
5peptides
spectra
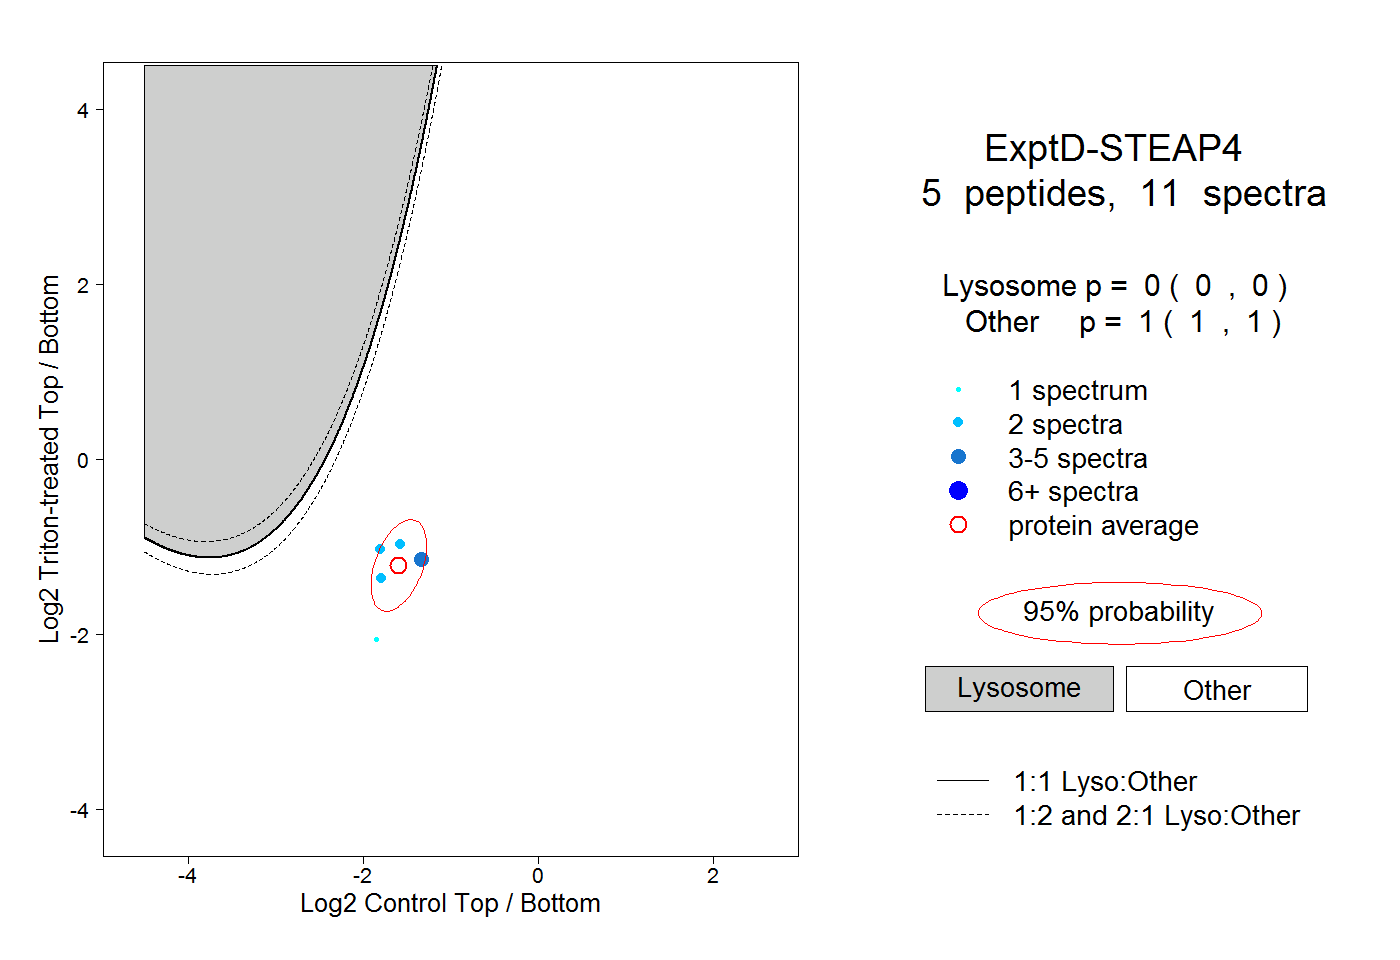
0.000 | 0.000
1.000 | 1.000