19
19peptides
spectra
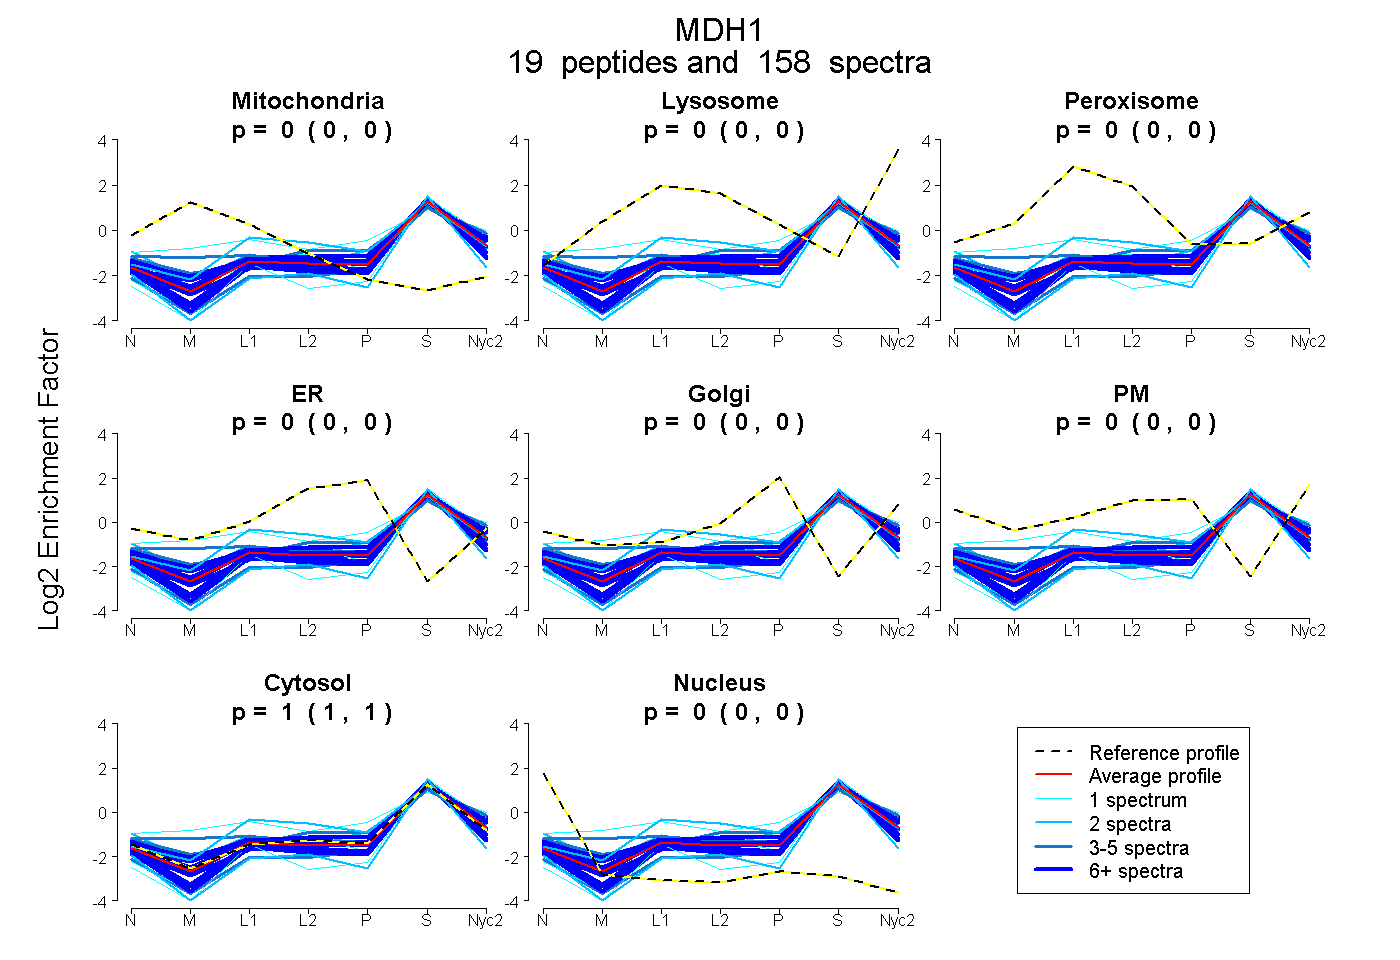
0.000 | 0.000
0.000 | 0.000
0.000 | 0.000
0.000 | 0.000
0.000 | 0.000
0.000 | 0.000
1.000 | 1.000
0.000 | 0.000
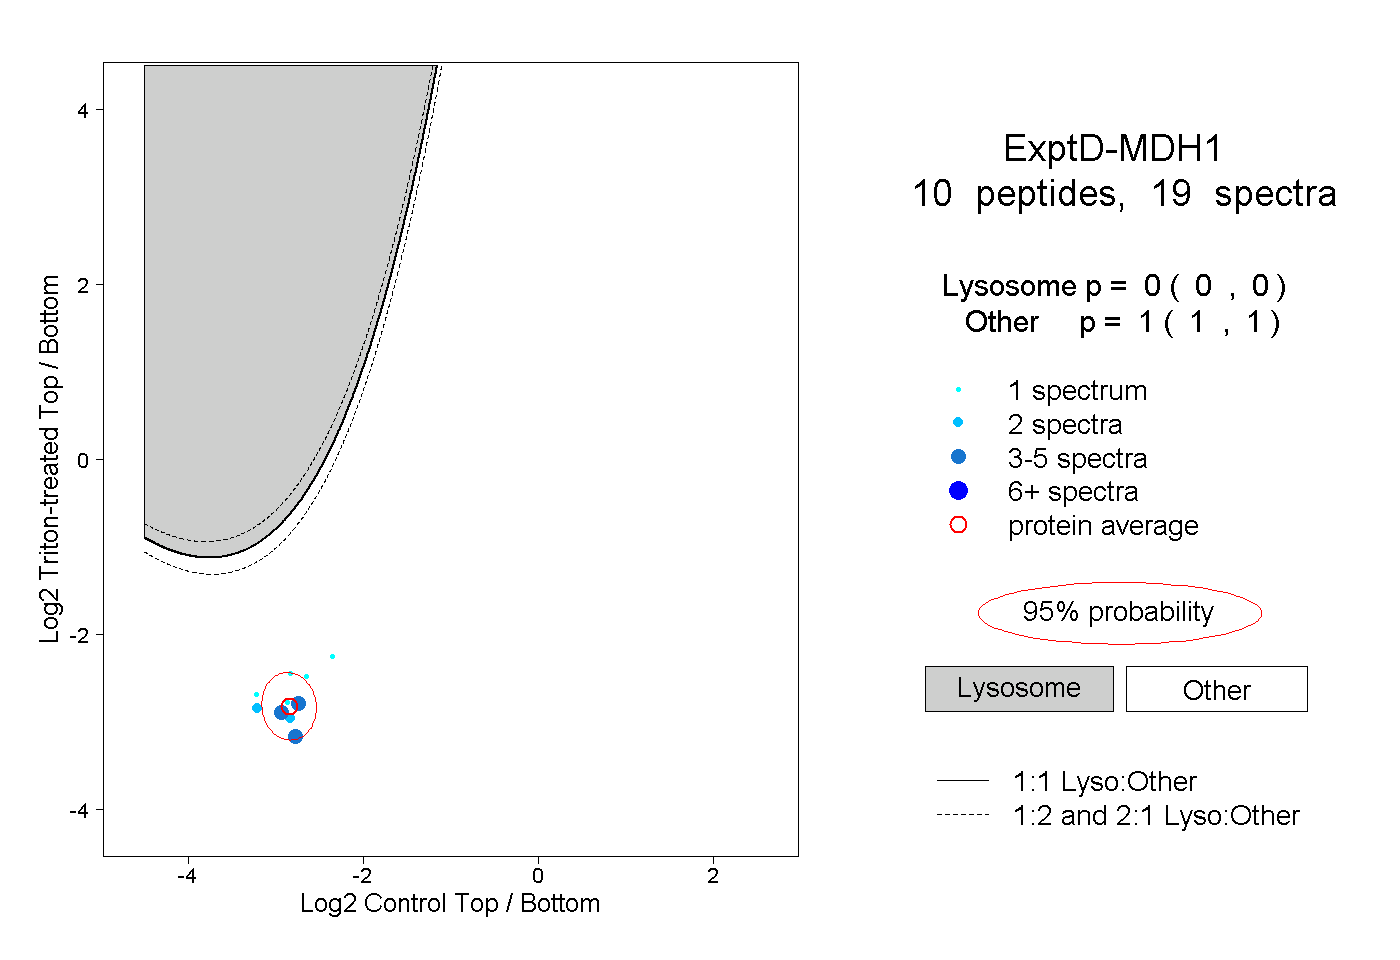
10peptides
spectra
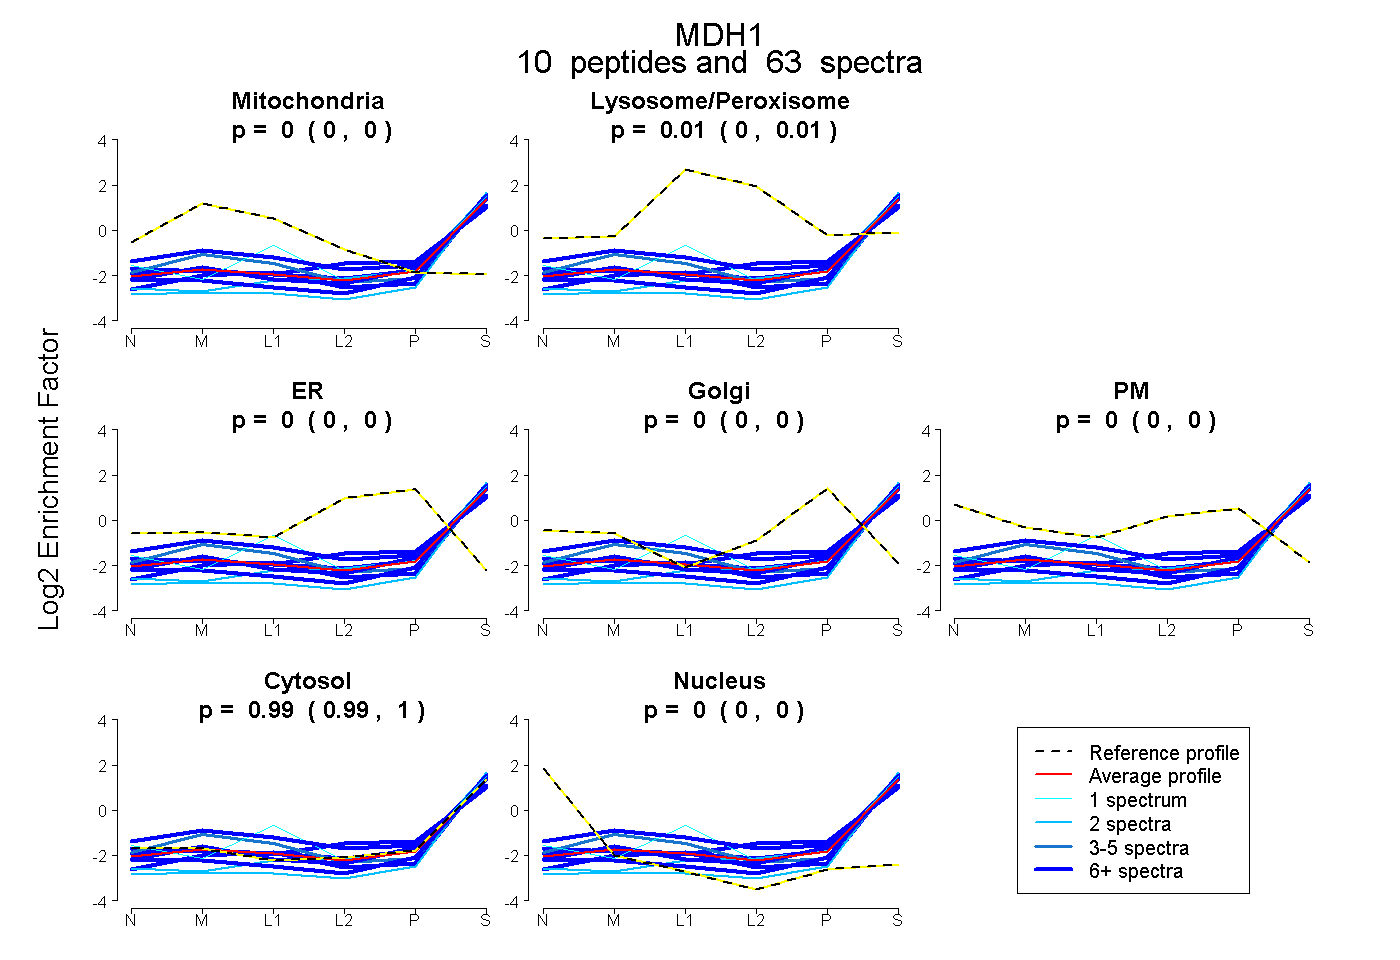
0.000 | 0.000
0.001 | 0.010
0.000 | 0.000
0.000 | 0.000
0.000 | 0.000
0.988 | 0.998
0.000 | 0.000
17peptides
spectra
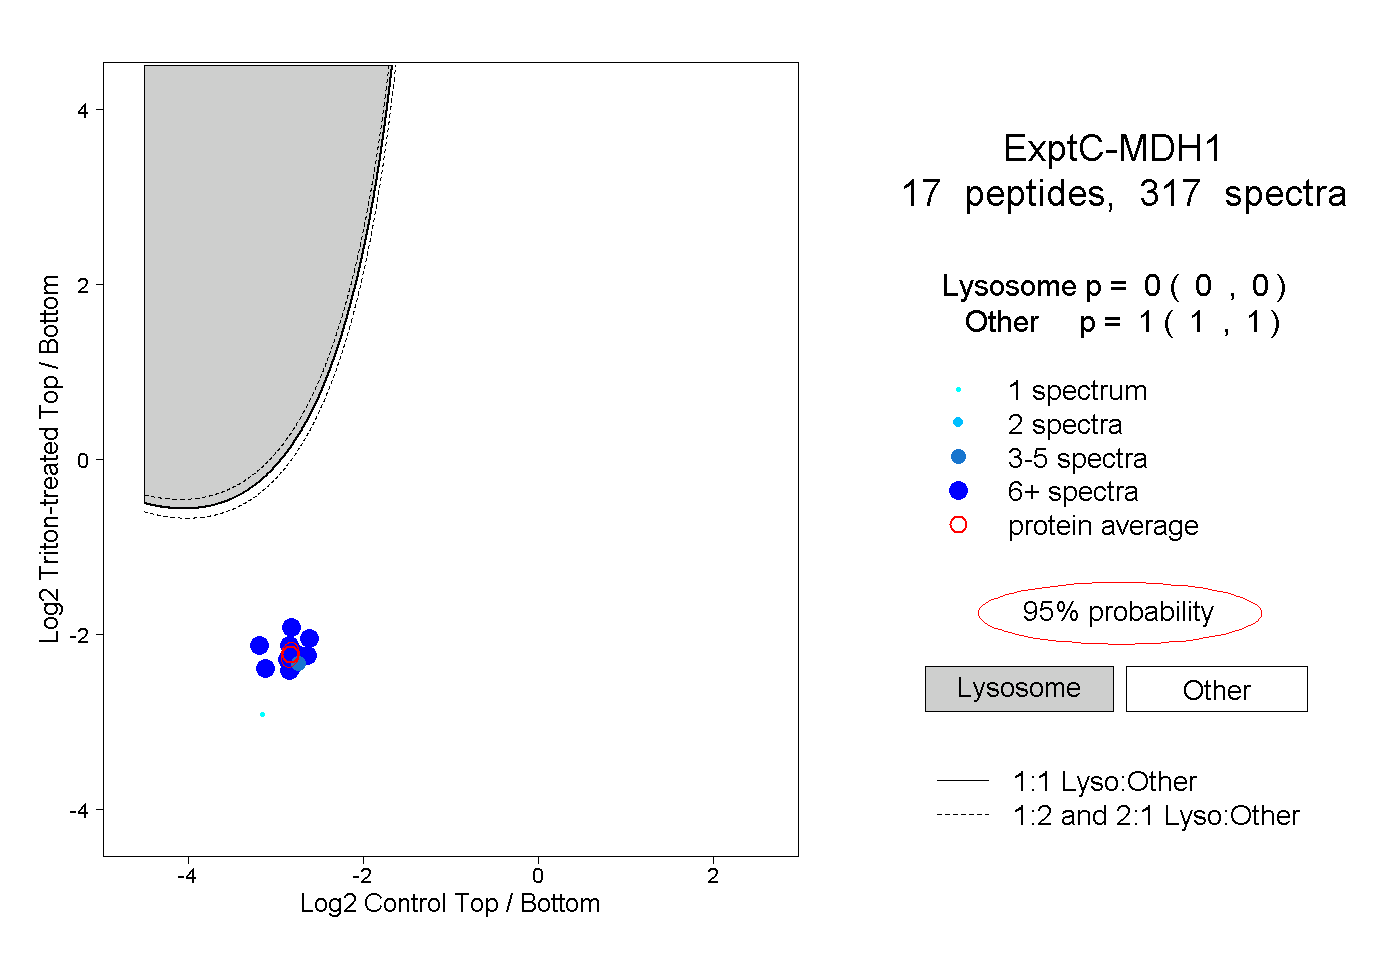
0.000 | 0.000
1.000 | 1.000