 1
1peptide
spectrum
NA | NA
NA | NA
NA | NA
NA | NA
NA | NA
NA | NA
NA | NA
NA | NA
1peptide
spectrum
NA | NA
NA | NA
1peptide
spectrum
NA | NA
NA | NA
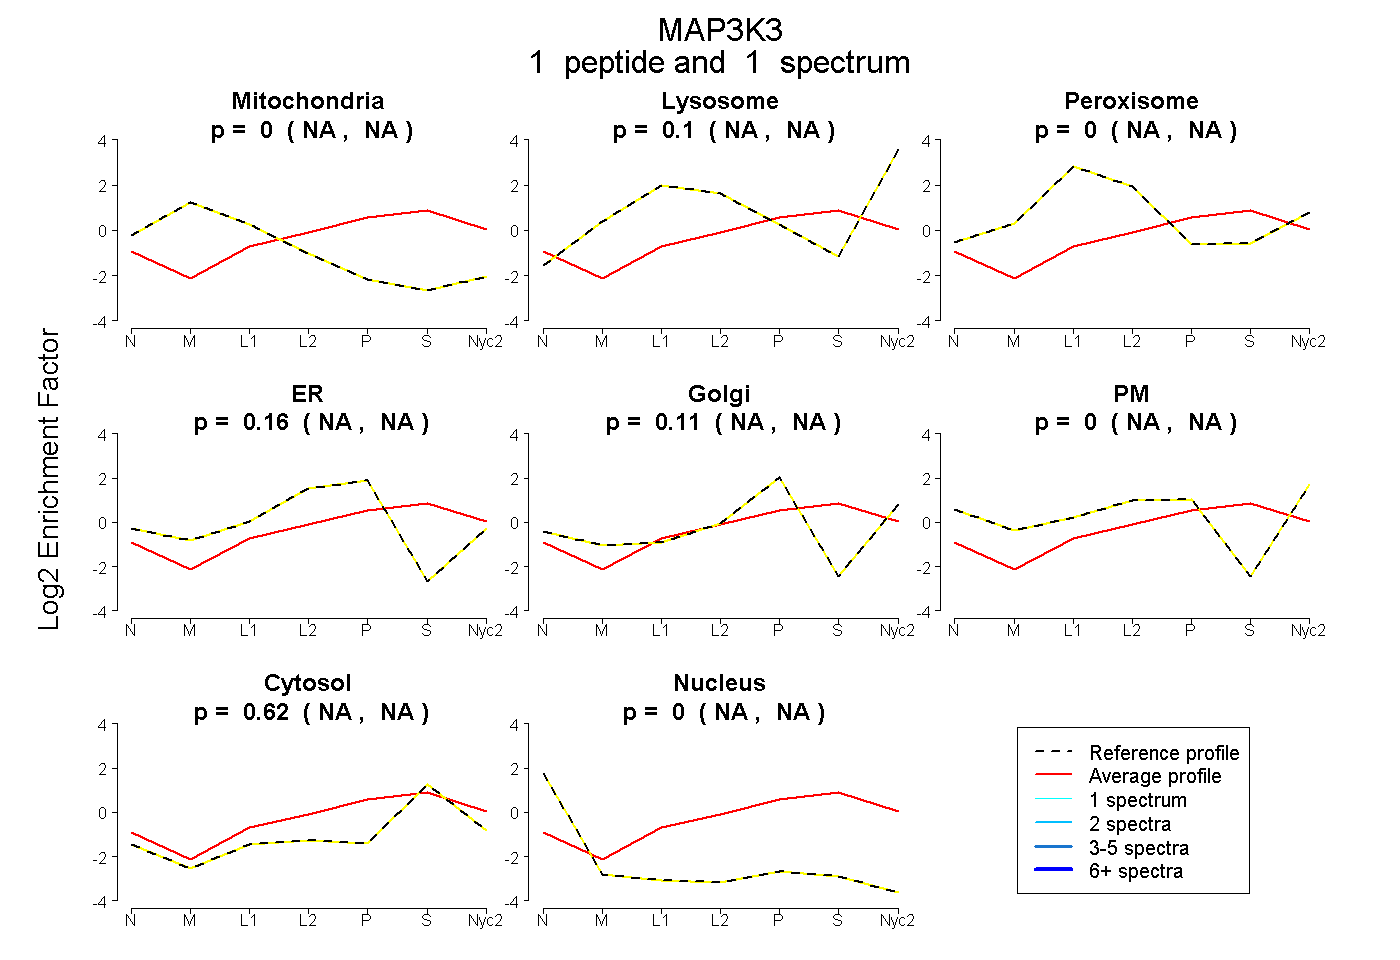
| Plot | Mito | Lyso | Perox | ER | Golgi | PM | Cytosol | Nucleus | |||||
| Expt A |
1 peptide |
1 spectrum |
|
0.000 NA | NA |
0.105 NA | NA |
0.000 NA | NA |
0.160 NA | NA |
0.111 NA | NA |
0.000 NA | NA |
0.625 NA | NA |
0.000 NA | NA |
||
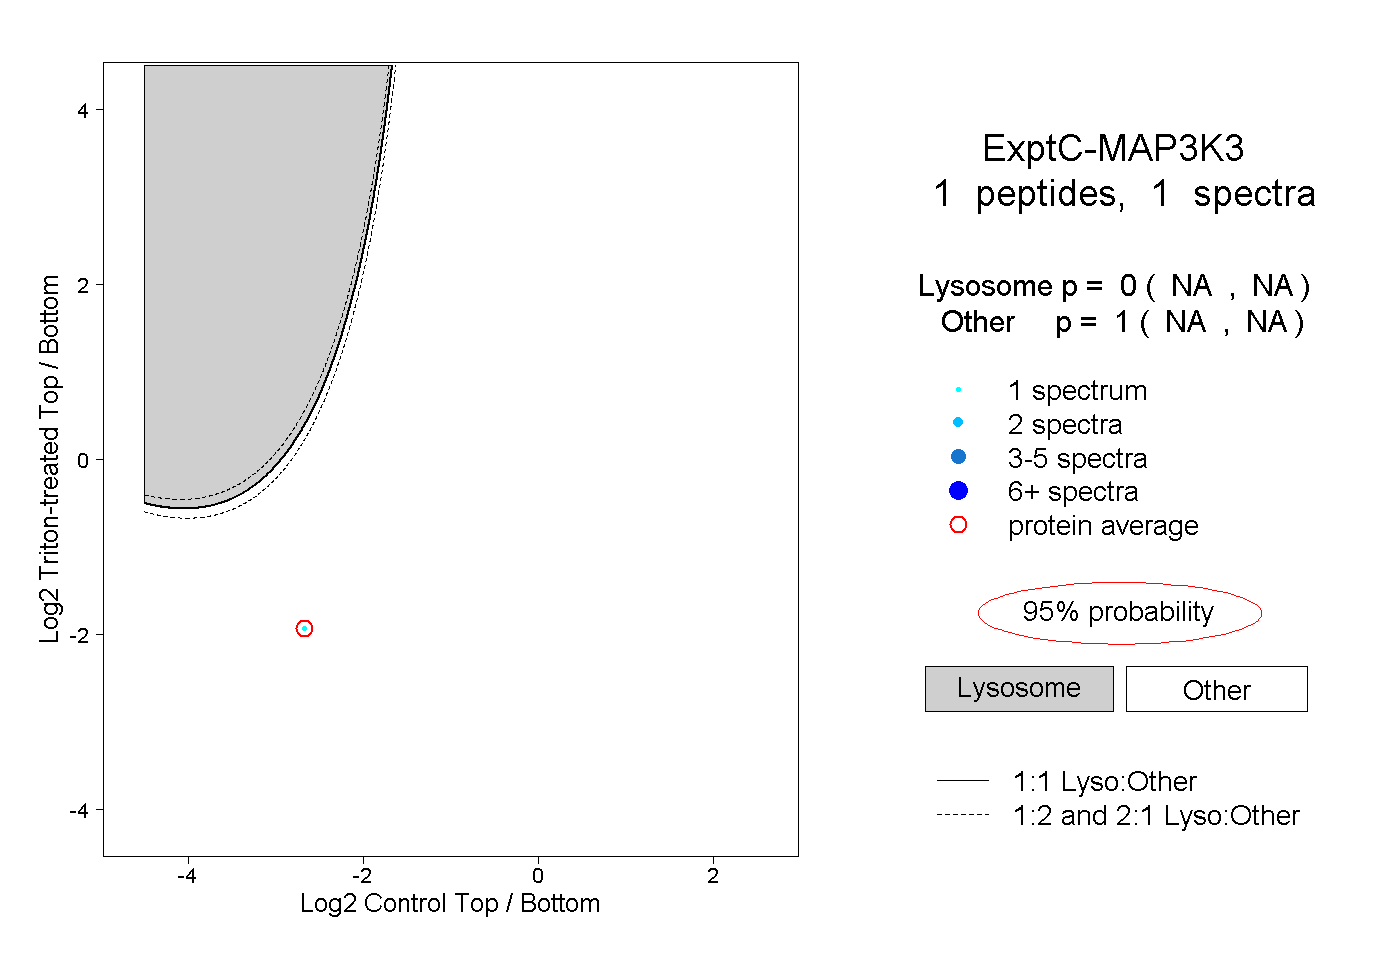
| Plot | Lyso | Other | |||||||||||
| Expt C |
1 peptide |
1 spectrum |
|
0.000 NA | NA |
1.000 NA | NA |
||||||||
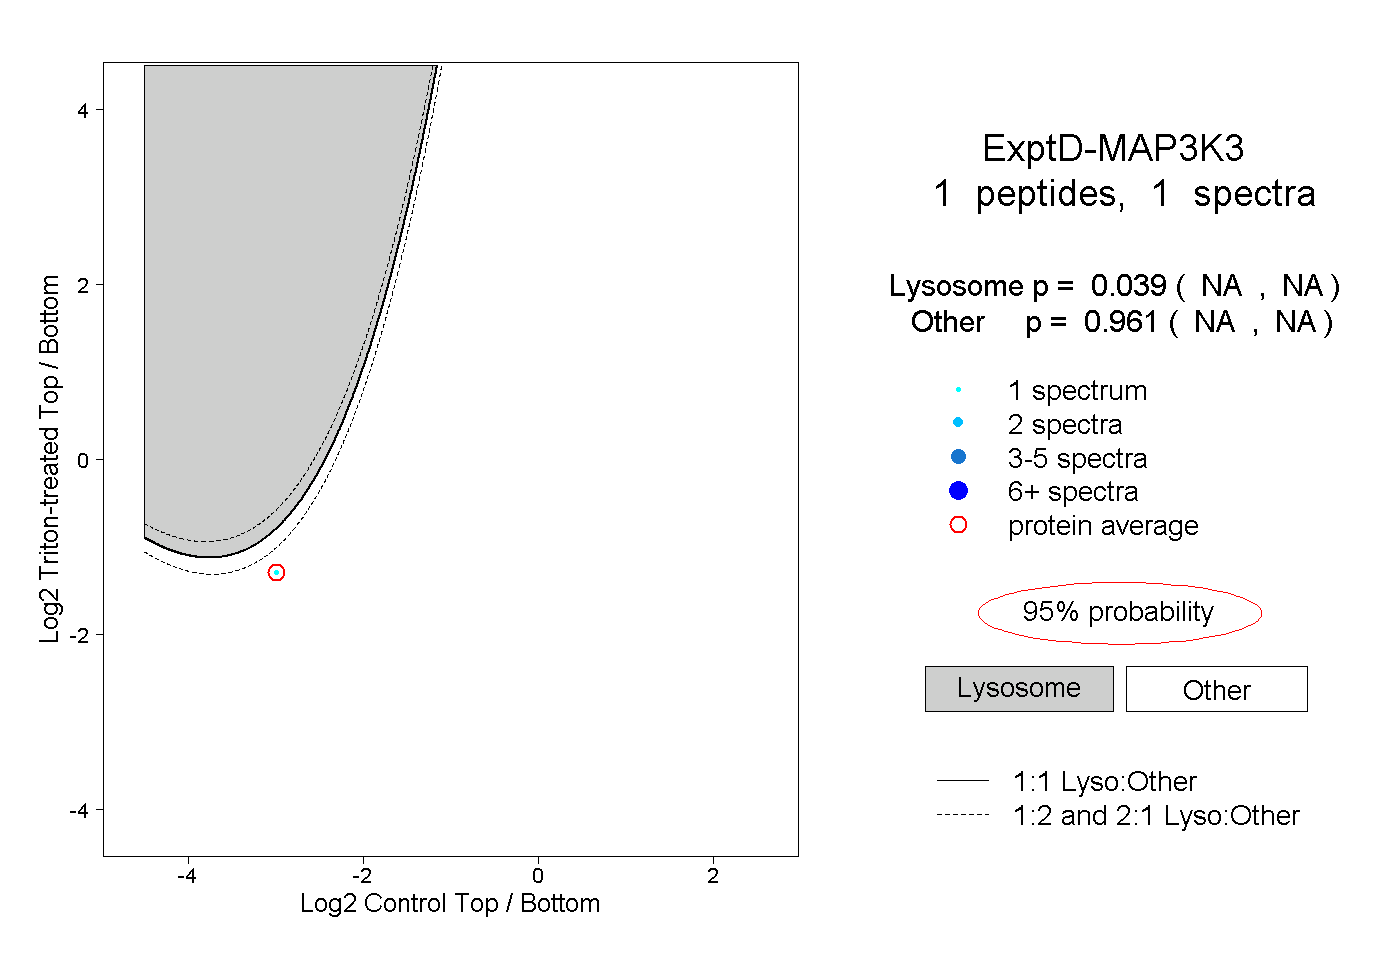
| Plot | Lyso | Other | |||||||||||
| Expt D |
1 peptide |
1 spectrum |
|
0.039 NA | NA |
0.961 NA | NA |