 12
12peptides
spectra
0.000 | 0.000
0.000 | 0.000
0.000 | 0.000
0.000 | 0.003
0.000 | 0.022
0.000 | 0.000
0.826 | 0.844
0.139 | 0.168
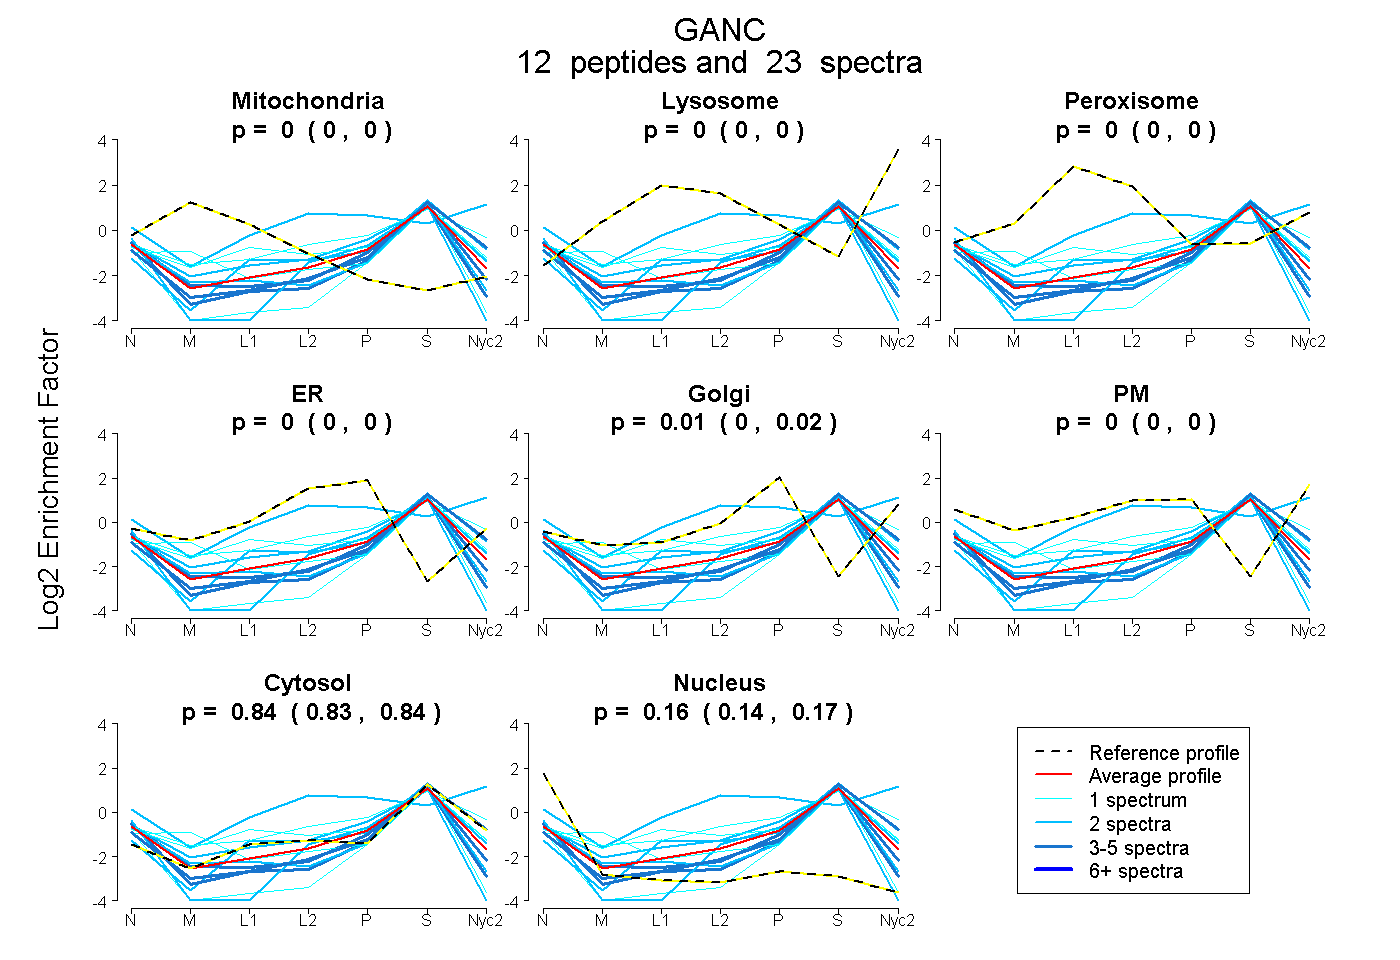
| Plot | Mito | Lyso | Perox | ER | Golgi | PM | Cytosol | Nucleus | |||||
| Expt A |
12 peptides |
23 spectra |
|
0.000 0.000 | 0.000 |
0.000 0.000 | 0.000 |
0.000 0.000 | 0.000 |
0.000 0.000 | 0.003 |
0.008 0.000 | 0.022 |
0.000 0.000 | 0.000 |
0.837 0.826 | 0.844 |
0.155 0.139 | 0.168 |
| 2 spectra, ERPFVLSR | 0.000 | 0.000 | 0.000 | 0.000 | 0.003 | 0.000 | 0.997 | 0.000 | ||
| 1 spectrum, MGIYGSVPYLLAHK | 0.161 | 0.000 | 0.000 | 0.000 | 0.000 | 0.000 | 0.791 | 0.048 | ||
| 2 spectra, ASLGSVSTEQDSTR | 0.000 | 0.113 | 0.023 | 0.000 | 0.000 | 0.464 | 0.400 | 0.000 | ||
| 1 spectrum, VDPDYTVYAEAK | 0.088 | 0.000 | 0.071 | 0.057 | 0.000 | 0.000 | 0.785 | 0.000 | ||
| 2 spectra, LYFEHLR | 0.000 | 0.000 | 0.000 | 0.000 | 0.000 | 0.000 | 0.736 | 0.264 | ||
| 2 spectra, IPLVAEVYGIEK | 0.000 | 0.000 | 0.000 | 0.000 | 0.000 | 0.000 | 0.603 | 0.397 | ||
| 3 spectra, IAFYR | 0.000 | 0.000 | 0.000 | 0.000 | 0.000 | 0.000 | 0.727 | 0.273 | ||
| 1 spectrum, TFAYWK | 0.000 | 0.000 | 0.022 | 0.000 | 0.102 | 0.153 | 0.723 | 0.000 | ||
| 3 spectra, FLFCSSVLTNR | 0.000 | 0.000 | 0.000 | 0.000 | 0.000 | 0.000 | 0.718 | 0.282 | ||
| 3 spectra, WNYEDEQDVK | 0.000 | 0.000 | 0.000 | 0.000 | 0.000 | 0.000 | 0.883 | 0.117 | ||
| 2 spectra, GGSVVPVK | 0.000 | 0.000 | 0.000 | 0.085 | 0.041 | 0.000 | 0.795 | 0.079 | ||
| 1 spectrum, EISVEDEAVDK | 0.000 | 0.000 | 0.000 | 0.000 | 0.000 | 0.000 | 0.595 | 0.405 |
| Plot | Mito | Lyso or Perox | ER | Golgi | PM | Cytosol | Nucleus | ||||||
| Expt B |
1 peptide |
2 spectra |
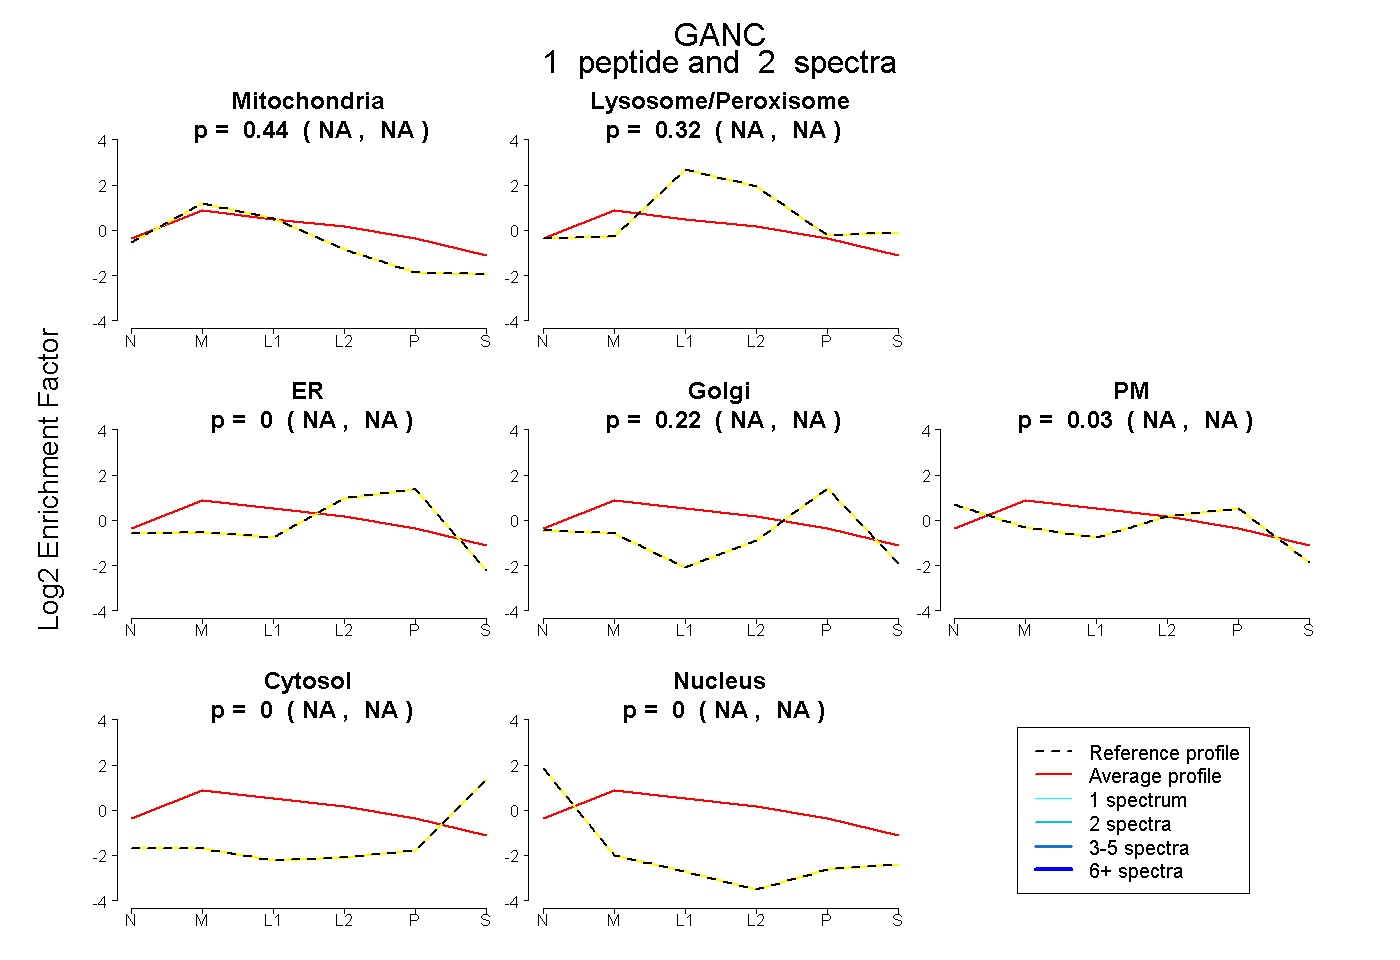 |
0.435 NA | NA |
0.316 NA | NA |
0.000 NA | NA |
0.215 NA | NA |
0.033 NA | NA |
0.000 NA | NA |
0.000 NA | NA |
|||
| Plot | Lyso | Other | |||||||||||
| Expt C |
3 peptides |
5 spectra |
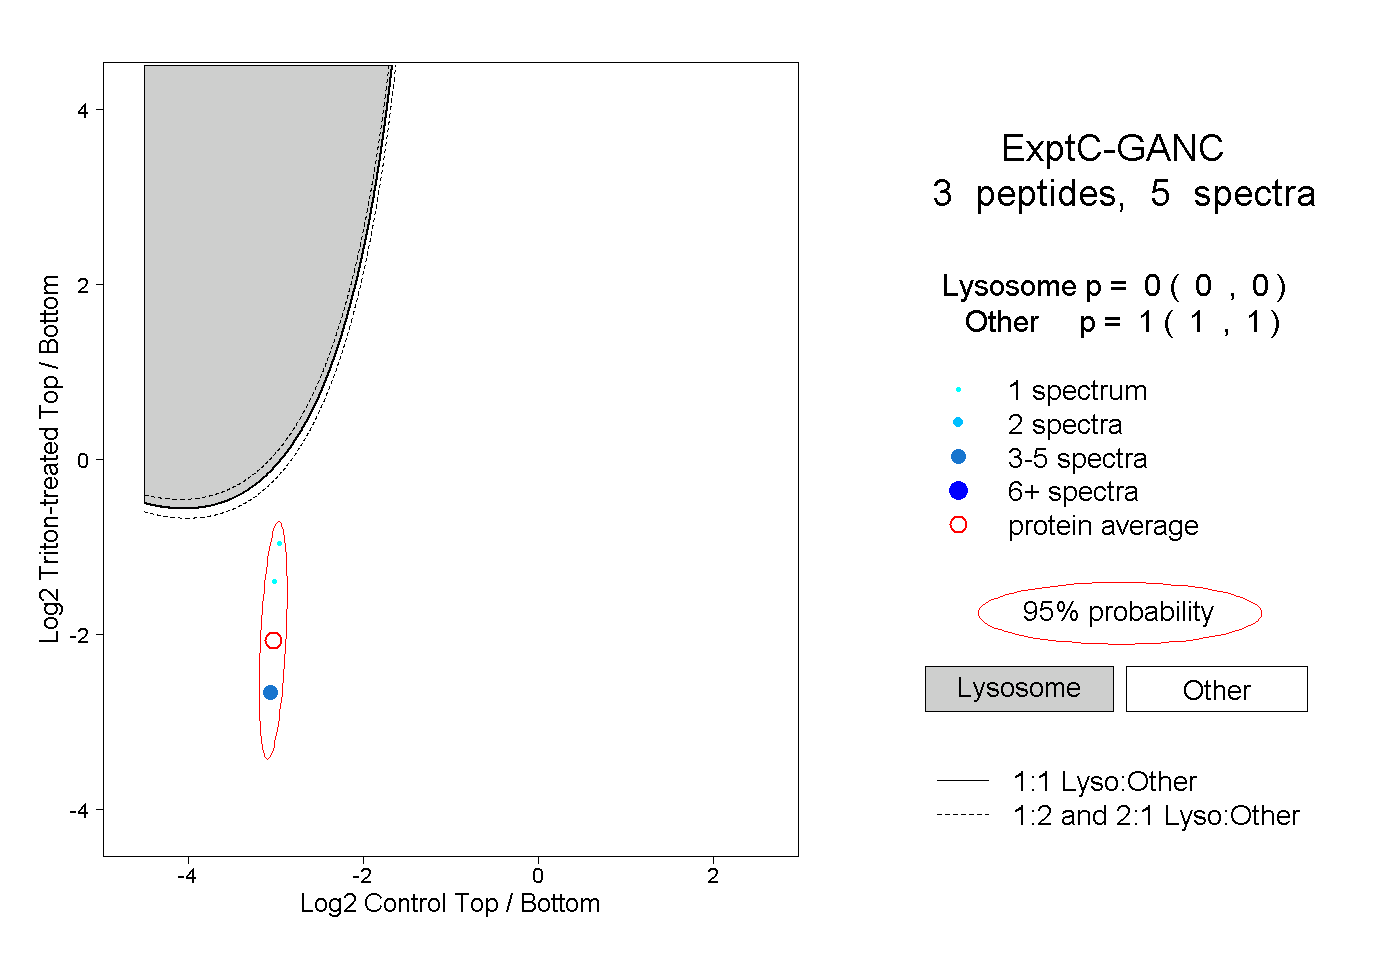 |
0.000 0.000 | 0.000 |
1.000 1.000 | 1.000 |
||||||||
| Plot | Lyso | Other | |||||||||||
| Expt D |
1 peptide |
1 spectrum |
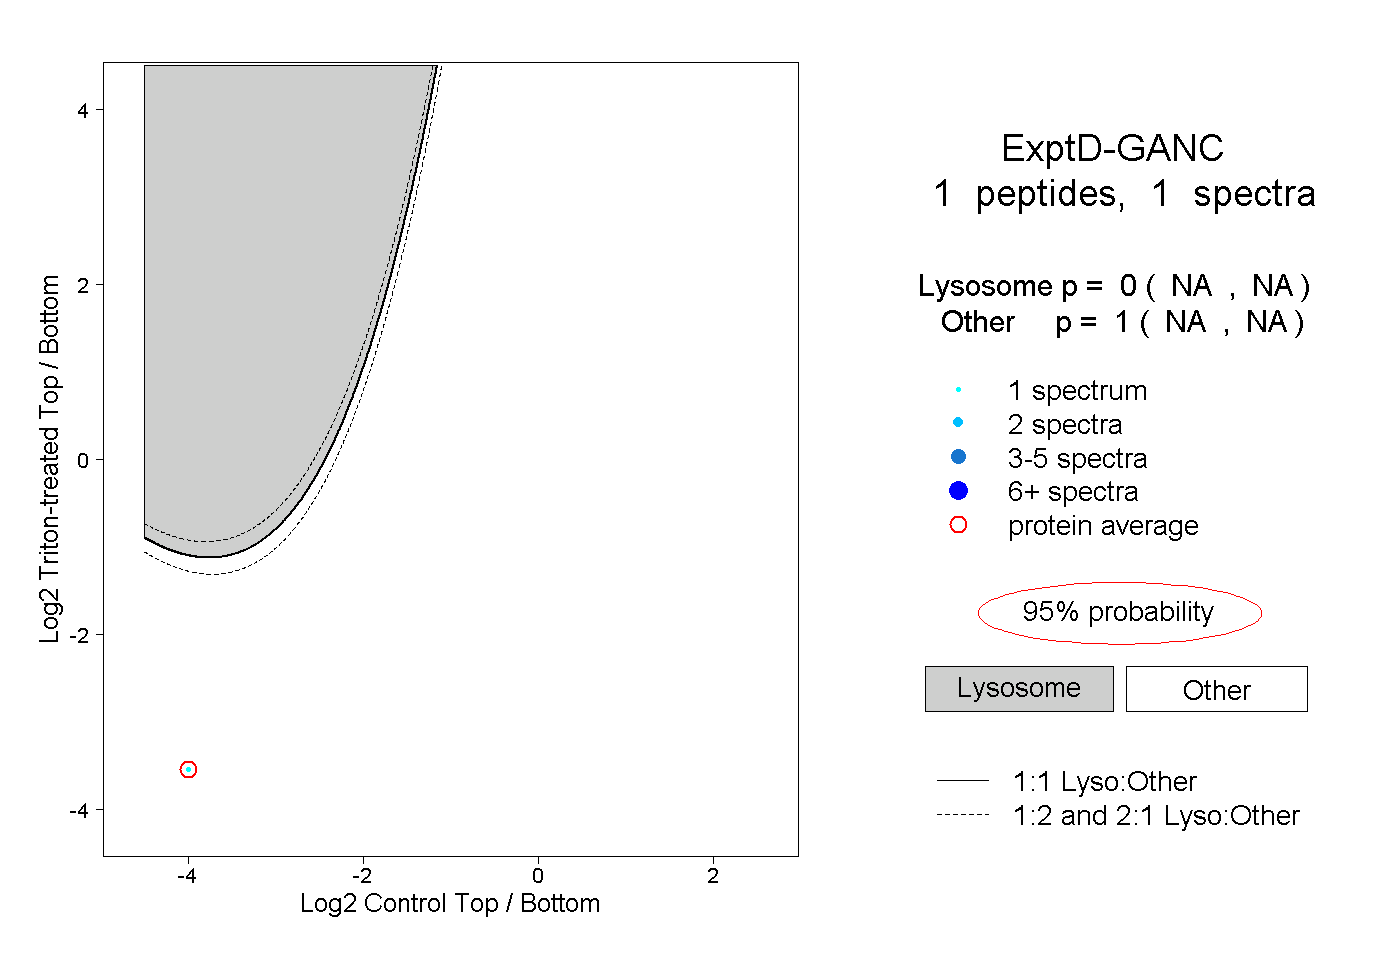 |
0.000 NA | NA |
1.000 NA | NA |