 3
3peptides
spectra
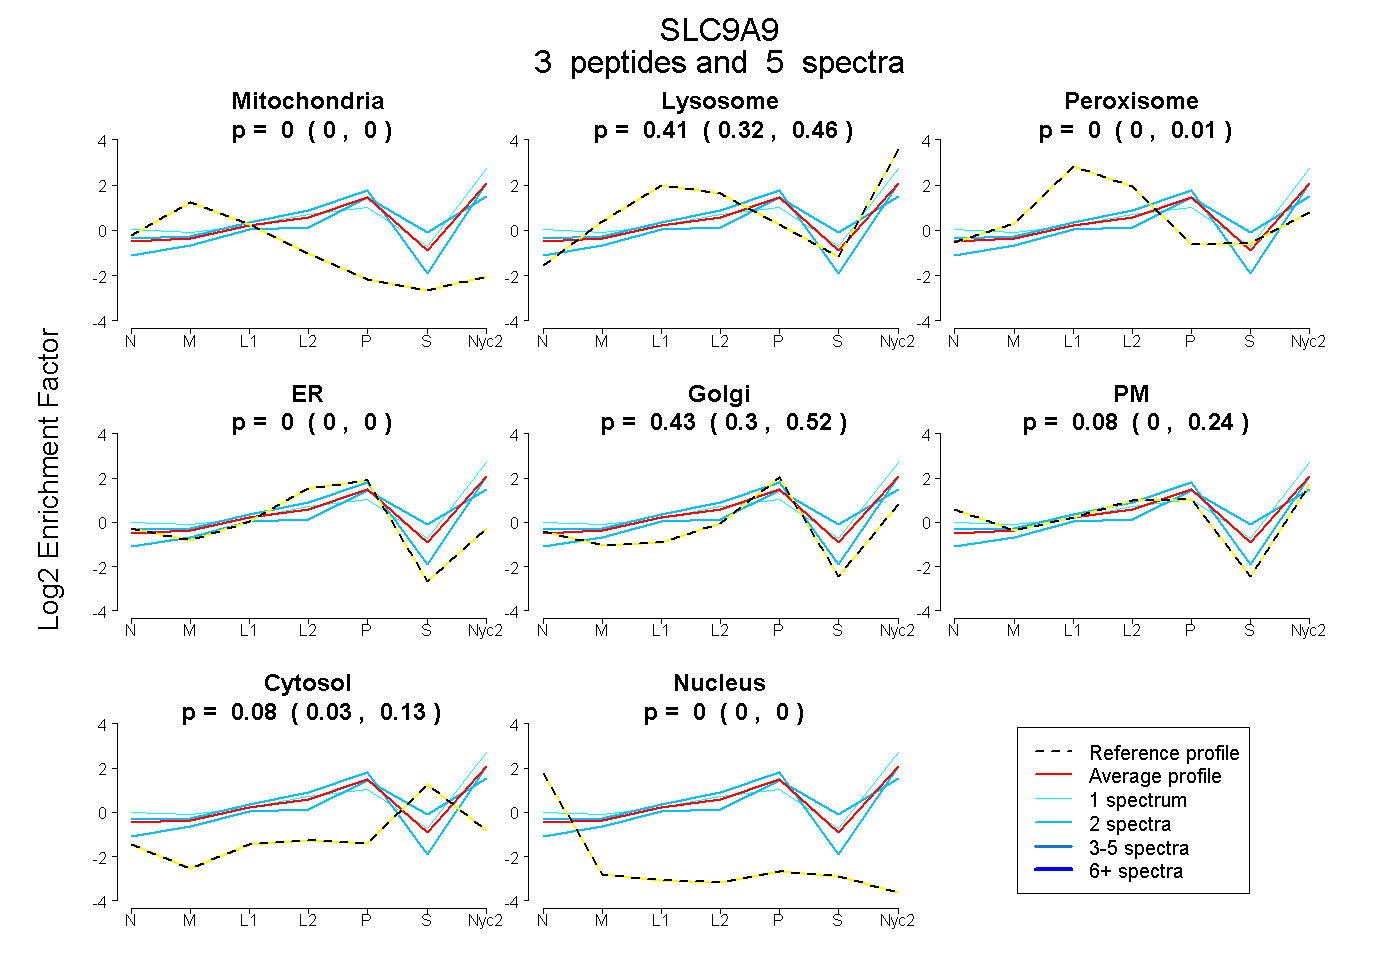
0.000 | 0.000
0.319 | 0.459
0.000 | 0.015
0.000 | 0.000
0.304 | 0.519
0.000 | 0.237
0.025 | 0.129
0.000 | 0.000
1peptide
spectrum
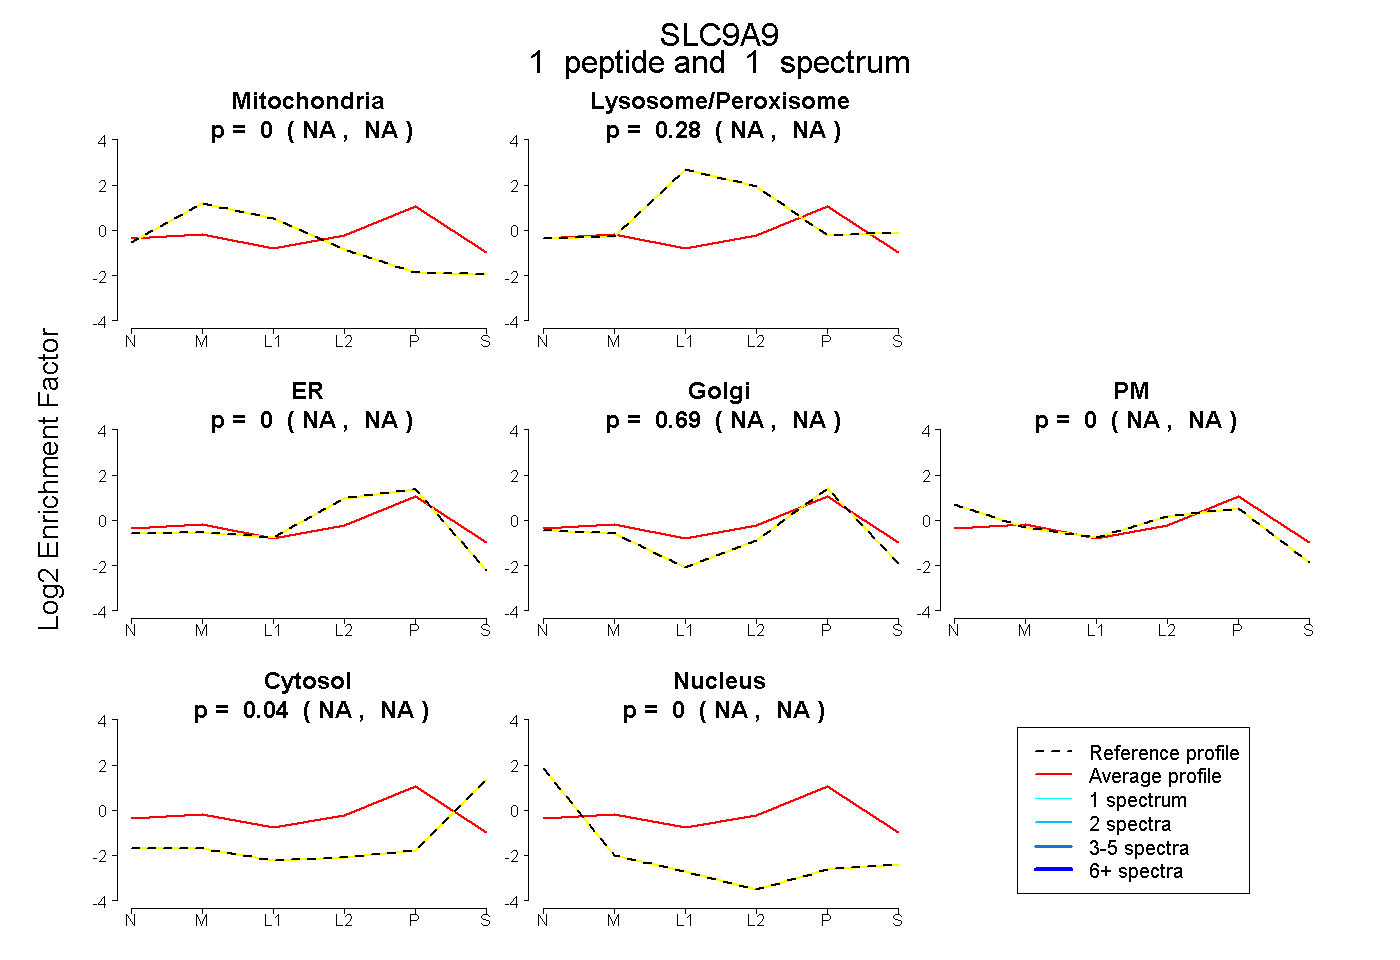
NA | NA
NA | NA
NA | NA
NA | NA
NA | NA
NA | NA
NA | NA
1peptide
spectra
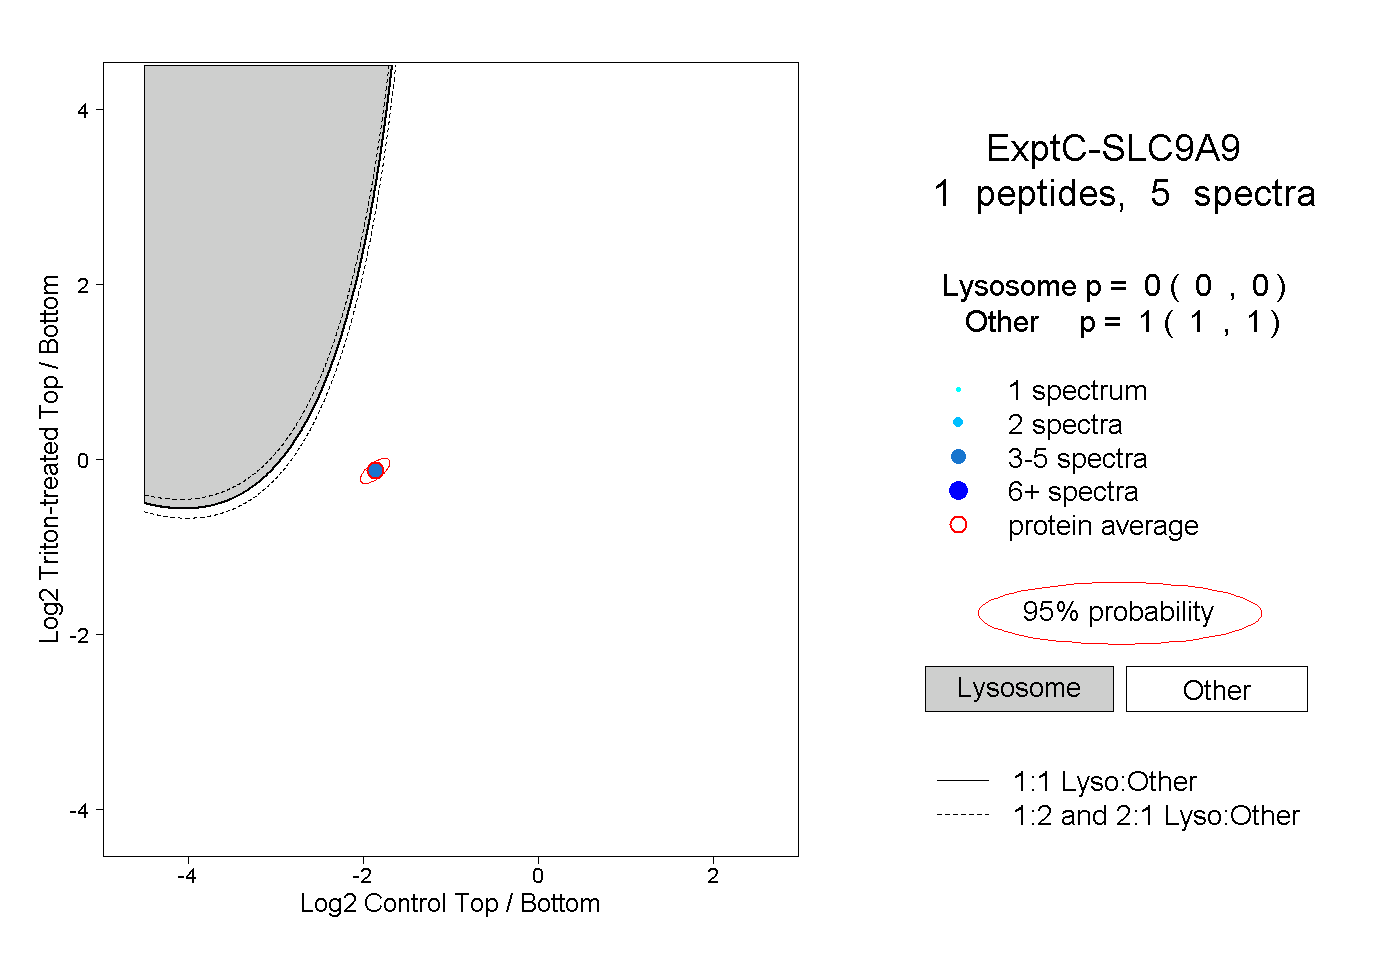
0.000 | 0.000
1.000 | 1.000