 2
2peptides
spectra
0.000 | 0.000
0.903 | 0.998
0.000 | 0.000
0.000 | 0.084
0.000 | 0.000
0.000 | 0.000
0.000 | 0.000
0.000 | 0.000
7peptides
spectra
0.000 | 1.000
0.000 | 1.000
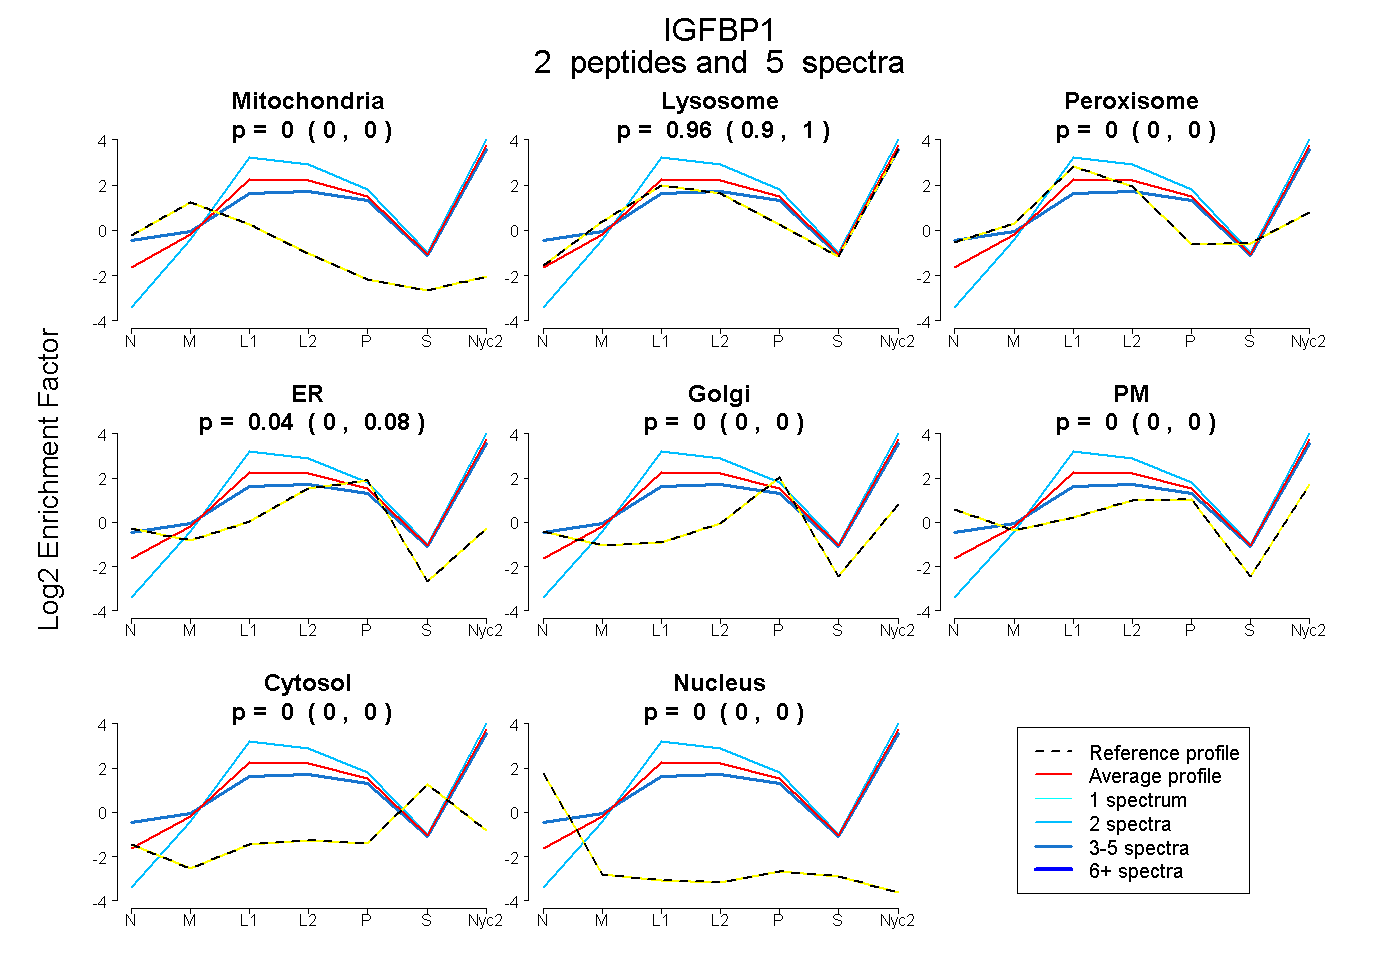
| Plot | Mito | Lyso | Perox | ER | Golgi | PM | Cytosol | Nucleus | |||||
| Expt A |
2 peptides |
5 spectra |
|
0.000 0.000 | 0.000 |
0.956 0.903 | 0.998 |
0.000 0.000 | 0.000 |
0.044 0.000 | 0.084 |
0.000 0.000 | 0.000 |
0.000 0.000 | 0.000 |
0.000 0.000 | 0.000 |
0.000 0.000 | 0.000 |
||
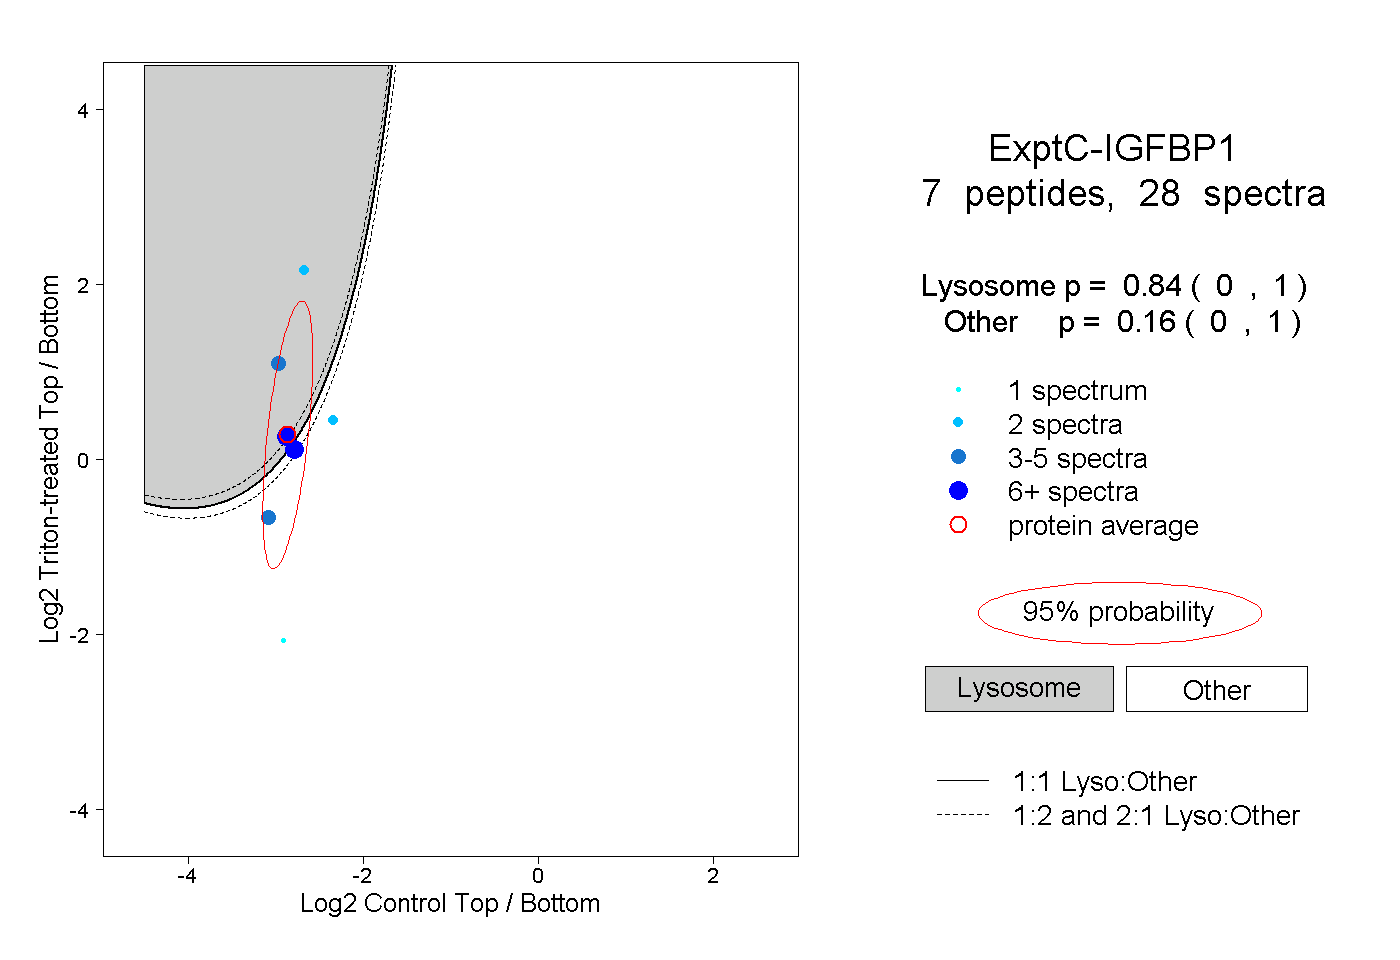
| Plot | Lyso | Other | |||||||||||
| Expt C |
7 peptides |
28 spectra |
|
0.840 0.000 | 1.000 |
0.160 0.000 | 1.000 |