 22
22peptides
spectra
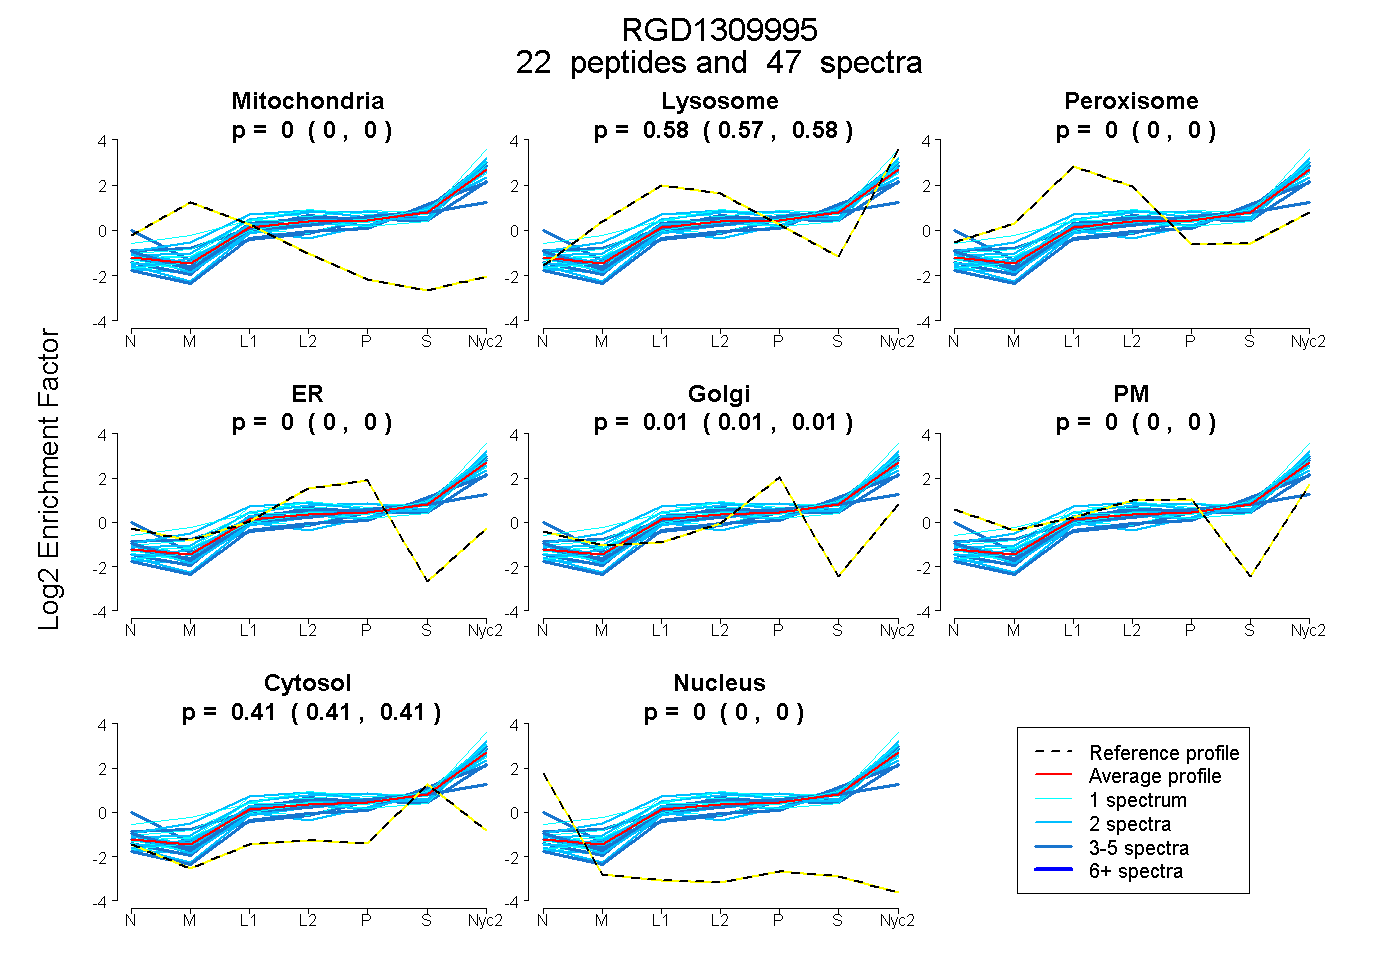
0.000 | 0.000
0.572 | 0.581
0.000 | 0.000
0.000 | 0.000
0.007 | 0.015
0.000 | 0.000
0.408 | 0.414
0.000 | 0.000
13peptides
spectra
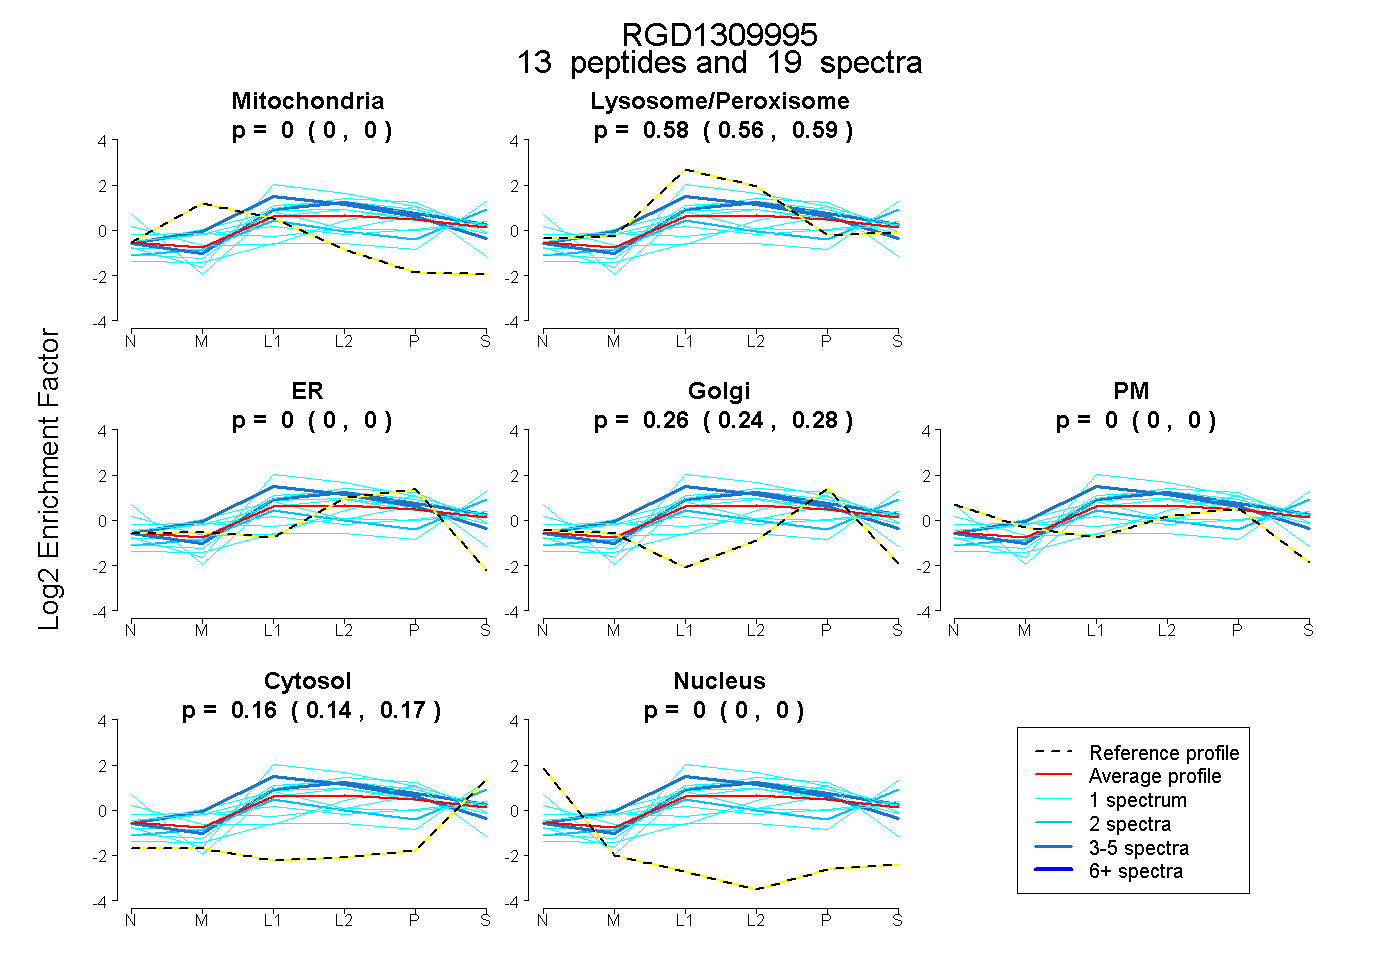
0.000 | 0.000
0.563 | 0.592
0.000 | 0.000
0.241 | 0.278
0.000 | 0.000
0.143 | 0.172
0.000 | 0.000
33peptides
spectra
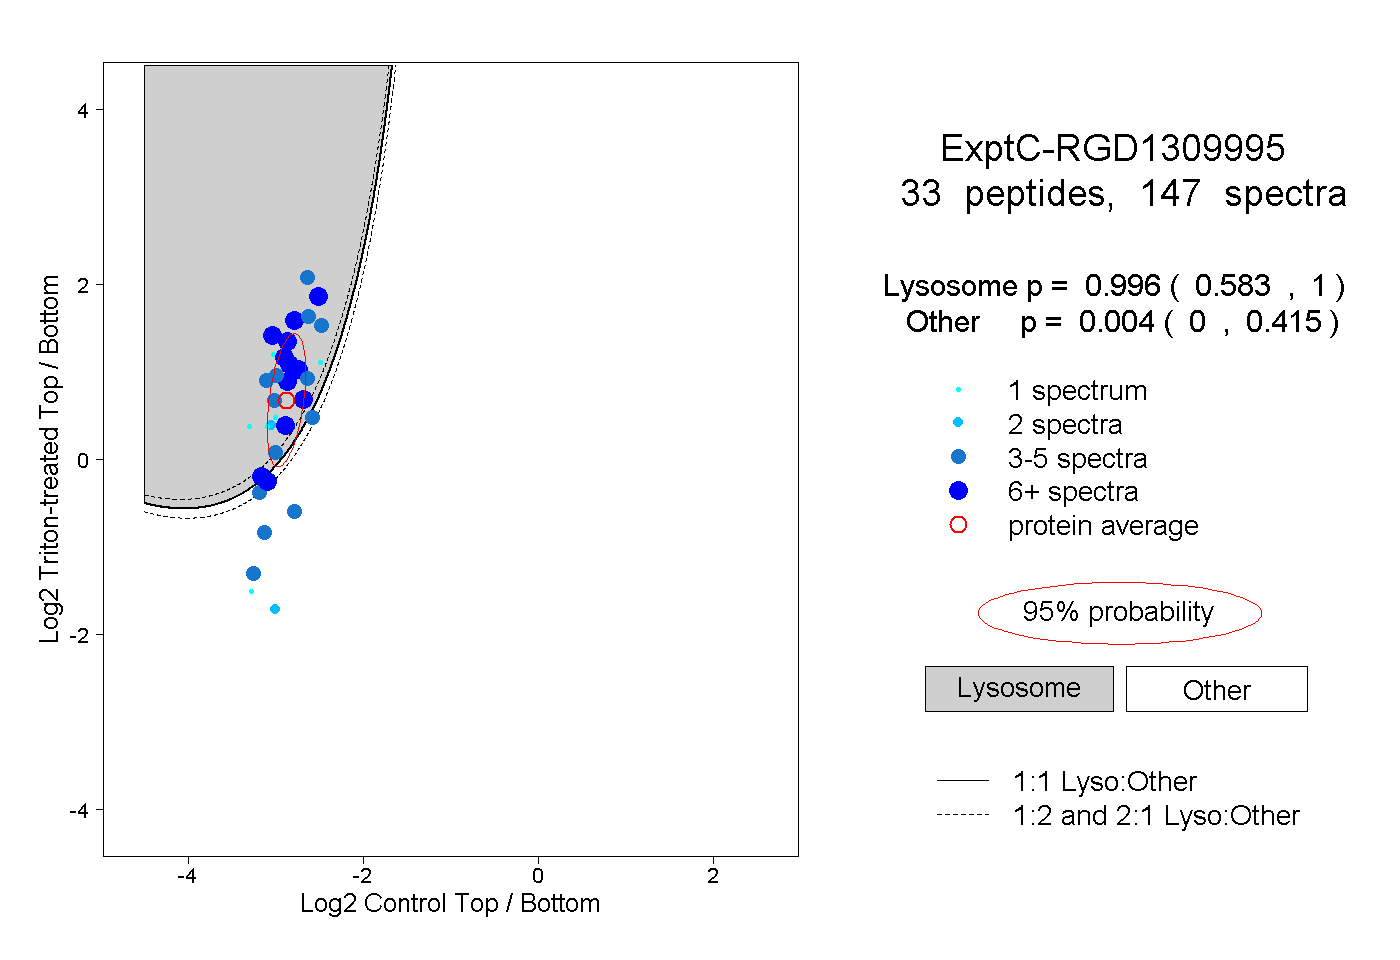
0.583 | 1.000
0.000 | 0.415
11peptides
spectra
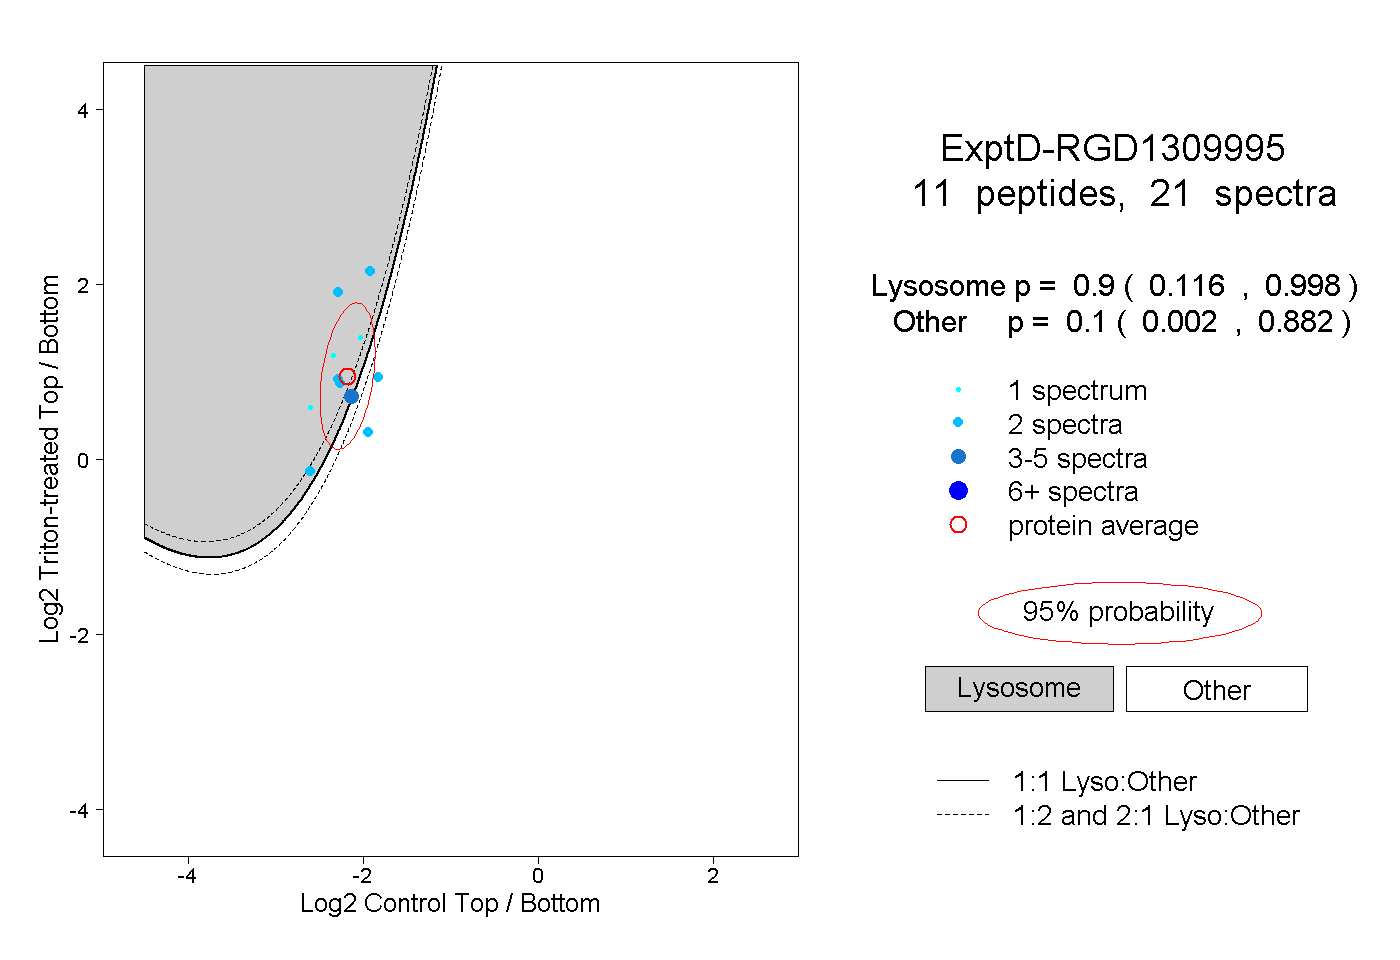
0.116 | 0.998
0.002 | 0.882