 7
7peptides
spectra
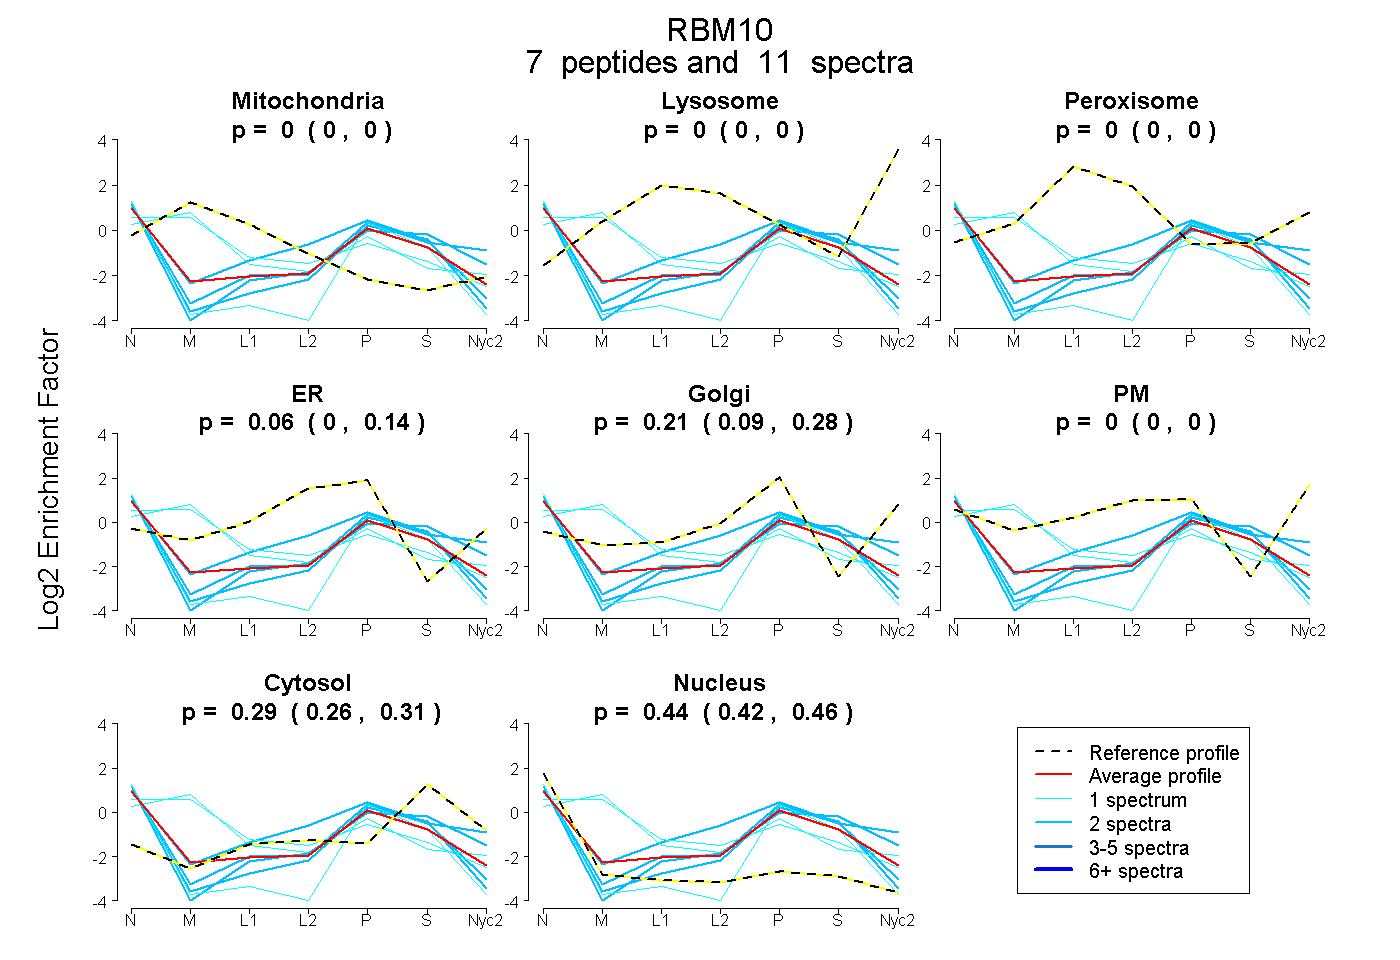
0.000 | 0.000
0.000 | 0.000
0.000 | 0.000
0.000 | 0.144
0.095 | 0.277
0.000 | 0.000
0.262 | 0.314
0.416 | 0.462
| Plot | Mito | Lyso | Perox | ER | Golgi | PM | Cytosol | Nucleus | |||||
| Expt A |
7 peptides |
11 spectra |
|
0.000 0.000 | 0.000 |
0.000 0.000 | 0.000 |
0.000 0.000 | 0.000 |
0.065 0.000 | 0.144 |
0.205 0.095 | 0.277 |
0.000 0.000 | 0.000 |
0.290 0.262 | 0.314 |
0.441 0.416 | 0.462 |
| 2 spectra, DGLGSDNIGSR | 0.000 | 0.000 | 0.000 | 0.354 | 0.000 | 0.000 | 0.298 | 0.349 | ||
| 1 spectrum, QTQLNR | 0.525 | 0.000 | 0.000 | 0.017 | 0.157 | 0.000 | 0.104 | 0.197 | ||
| 1 spectrum, LDQQALPLGGR | 0.000 | 0.000 | 0.000 | 0.000 | 0.030 | 0.000 | 0.248 | 0.721 | ||
| 2 spectra, INEDWLCNK | 0.000 | 0.000 | 0.000 | 0.000 | 0.330 | 0.000 | 0.344 | 0.326 | ||
| 2 spectra, GFAFVEFSHLQDATR | 0.000 | 0.000 | 0.000 | 0.000 | 0.178 | 0.000 | 0.452 | 0.370 | ||
| 1 spectrum, ESATADAGYAILEK | 0.493 | 0.000 | 0.000 | 0.000 | 0.272 | 0.000 | 0.050 | 0.185 | ||
| 2 spectra, GQLQSHGVQAR | 0.000 | 0.000 | 0.000 | 0.059 | 0.039 | 0.000 | 0.343 | 0.559 |
| Plot | Mito | Lyso or Perox | ER | Golgi | PM | Cytosol | Nucleus | ||||||
| Expt B |
2 peptides |
2 spectra |
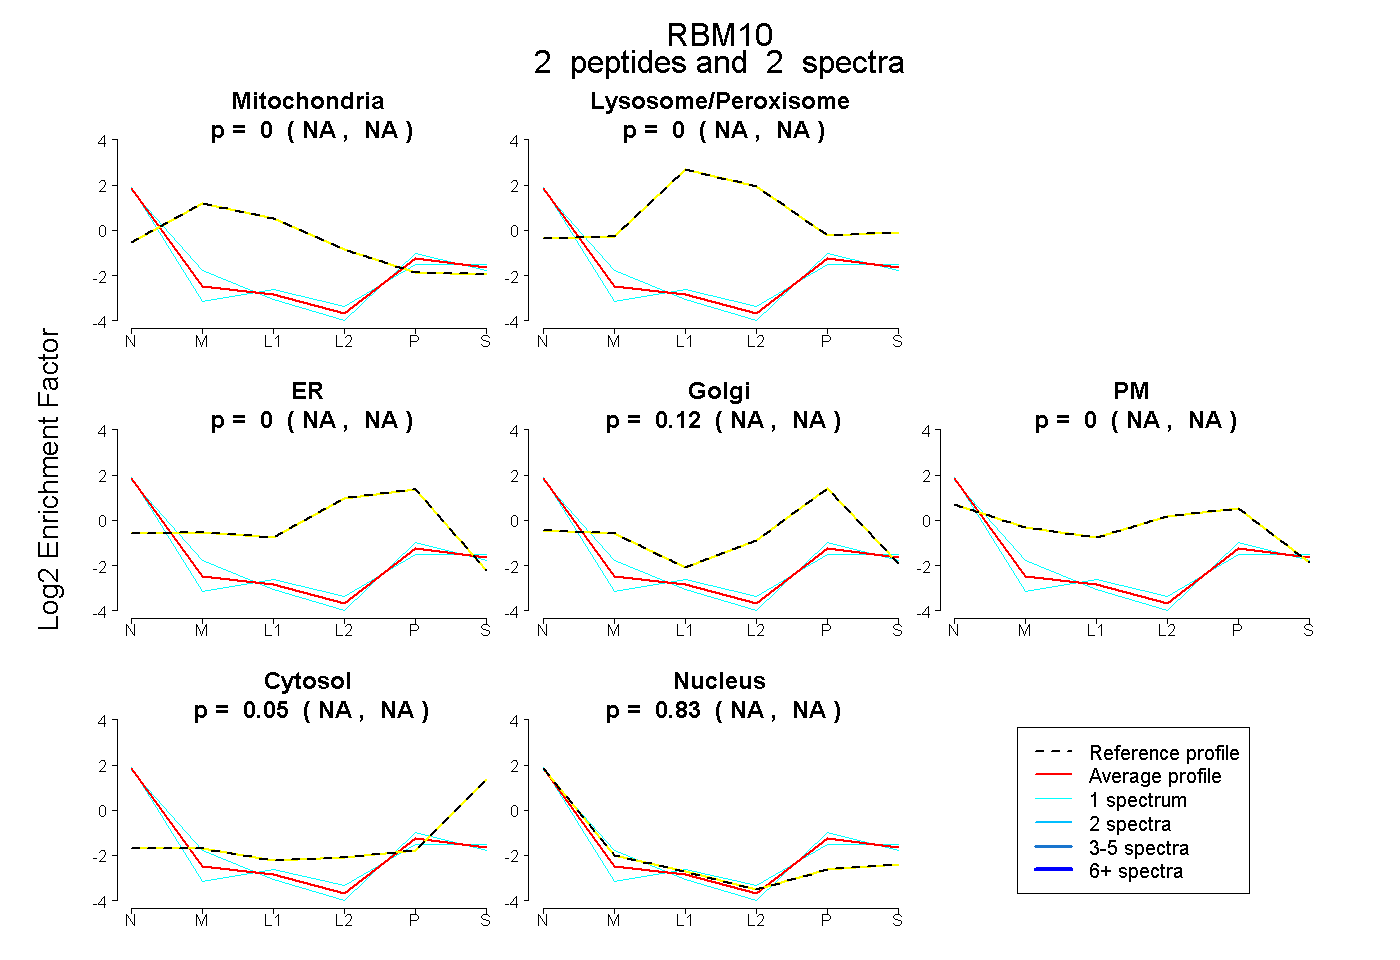 |
0.000 NA | NA |
0.000 NA | NA |
0.000 NA | NA |
0.123 NA | NA |
0.000 NA | NA |
0.045 NA | NA |
0.832 NA | NA |
|||
| Plot | Lyso | Other | |||||||||||
| Expt C |
2 peptides |
2 spectra |
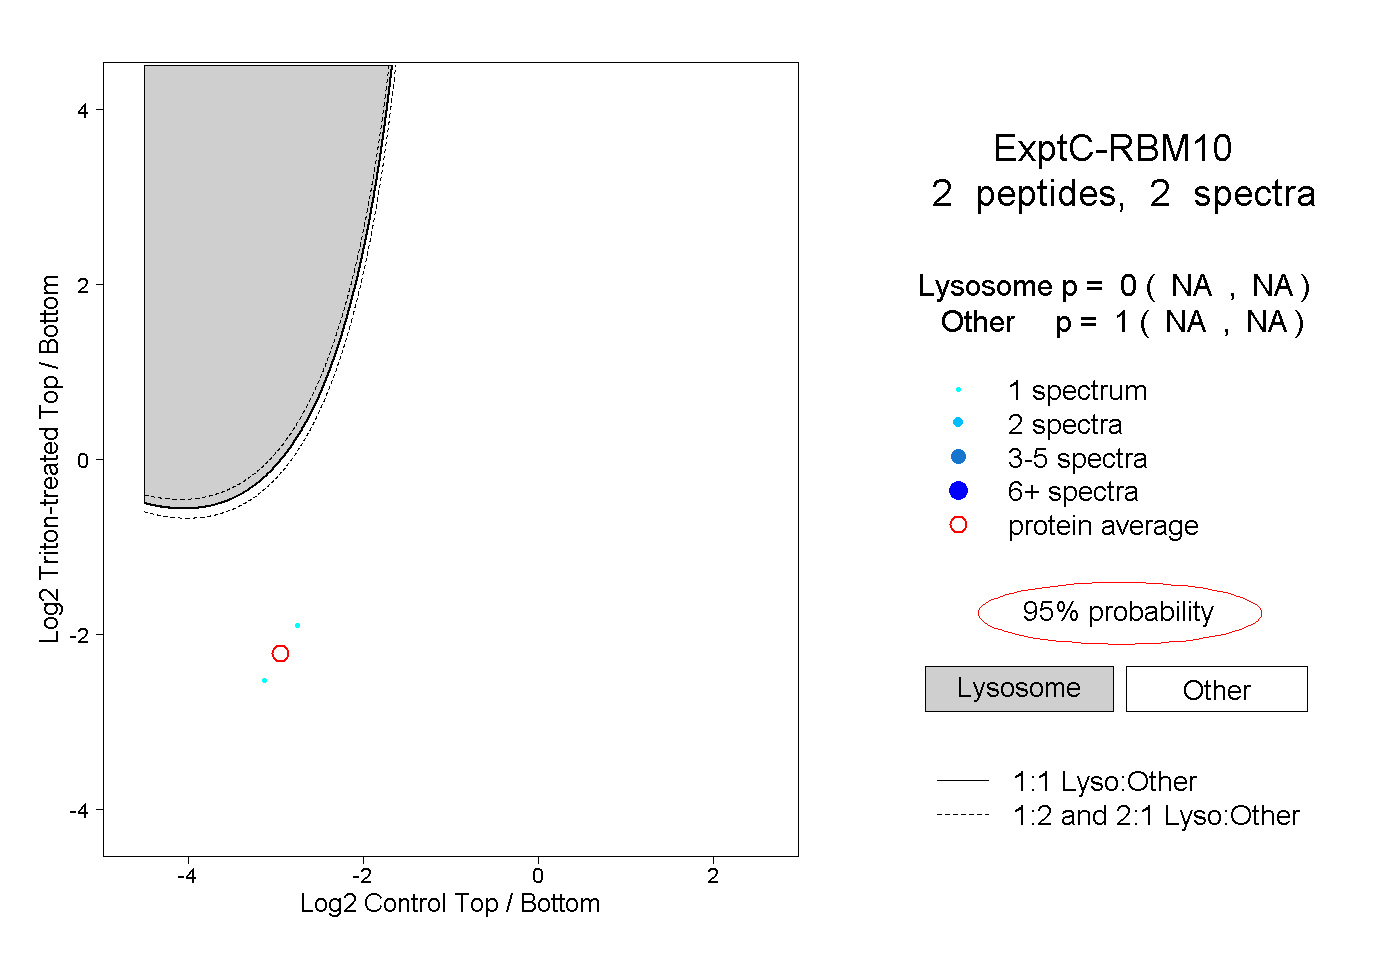 |
0.000 NA | NA |
1.000 NA | NA |