 4
4peptides
spectra
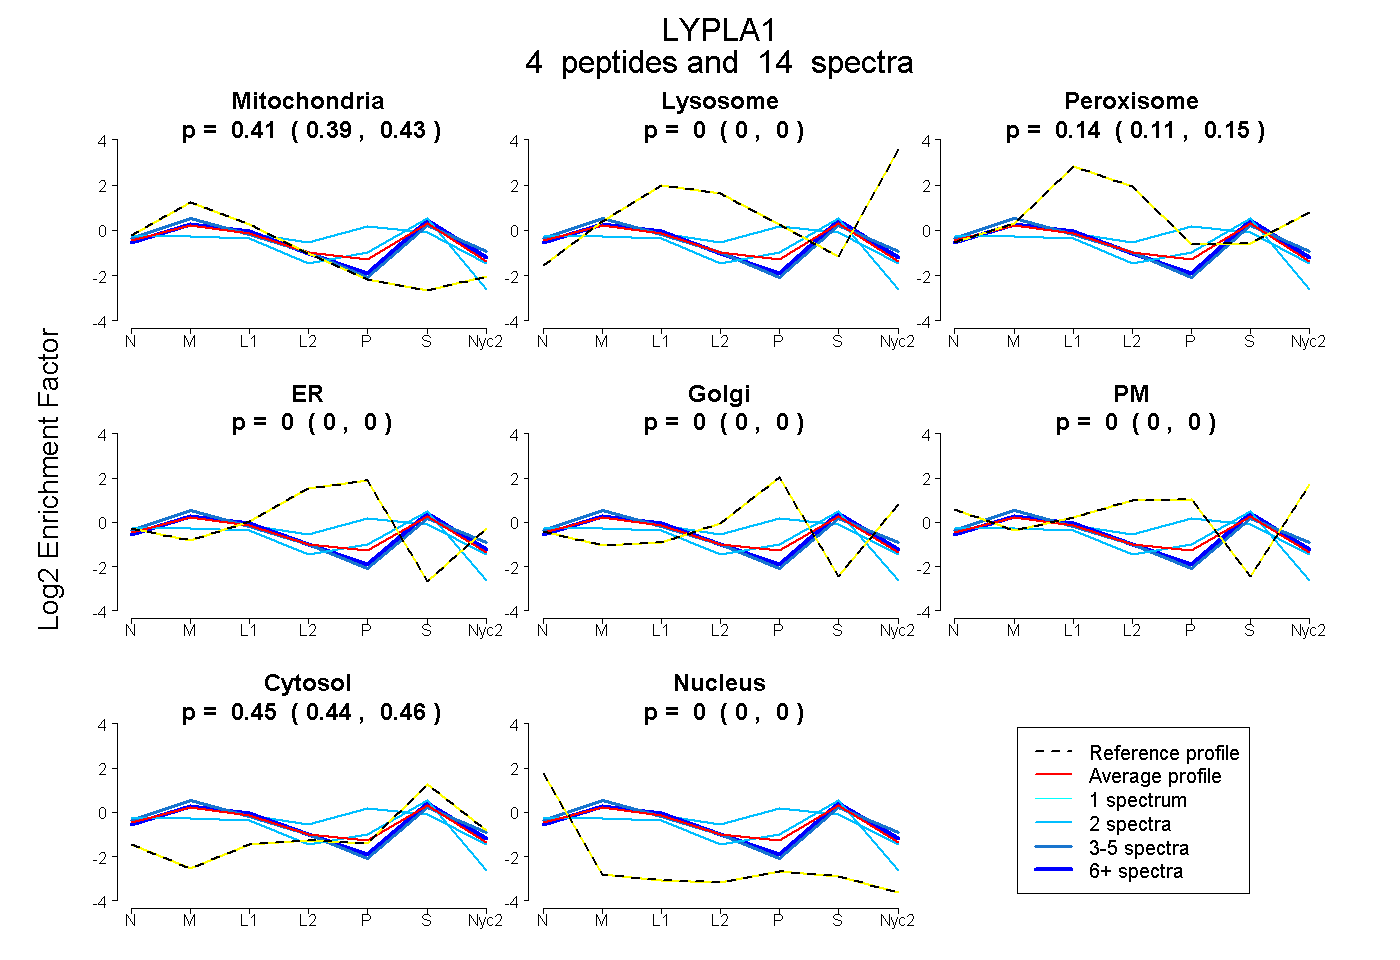
0.386 | 0.432
0.000 | 0.000
0.113 | 0.153
0.000 | 0.000
0.000 | 0.000
0.000 | 0.000
0.443 | 0.463
0.000 | 0.000
2peptides
spectra
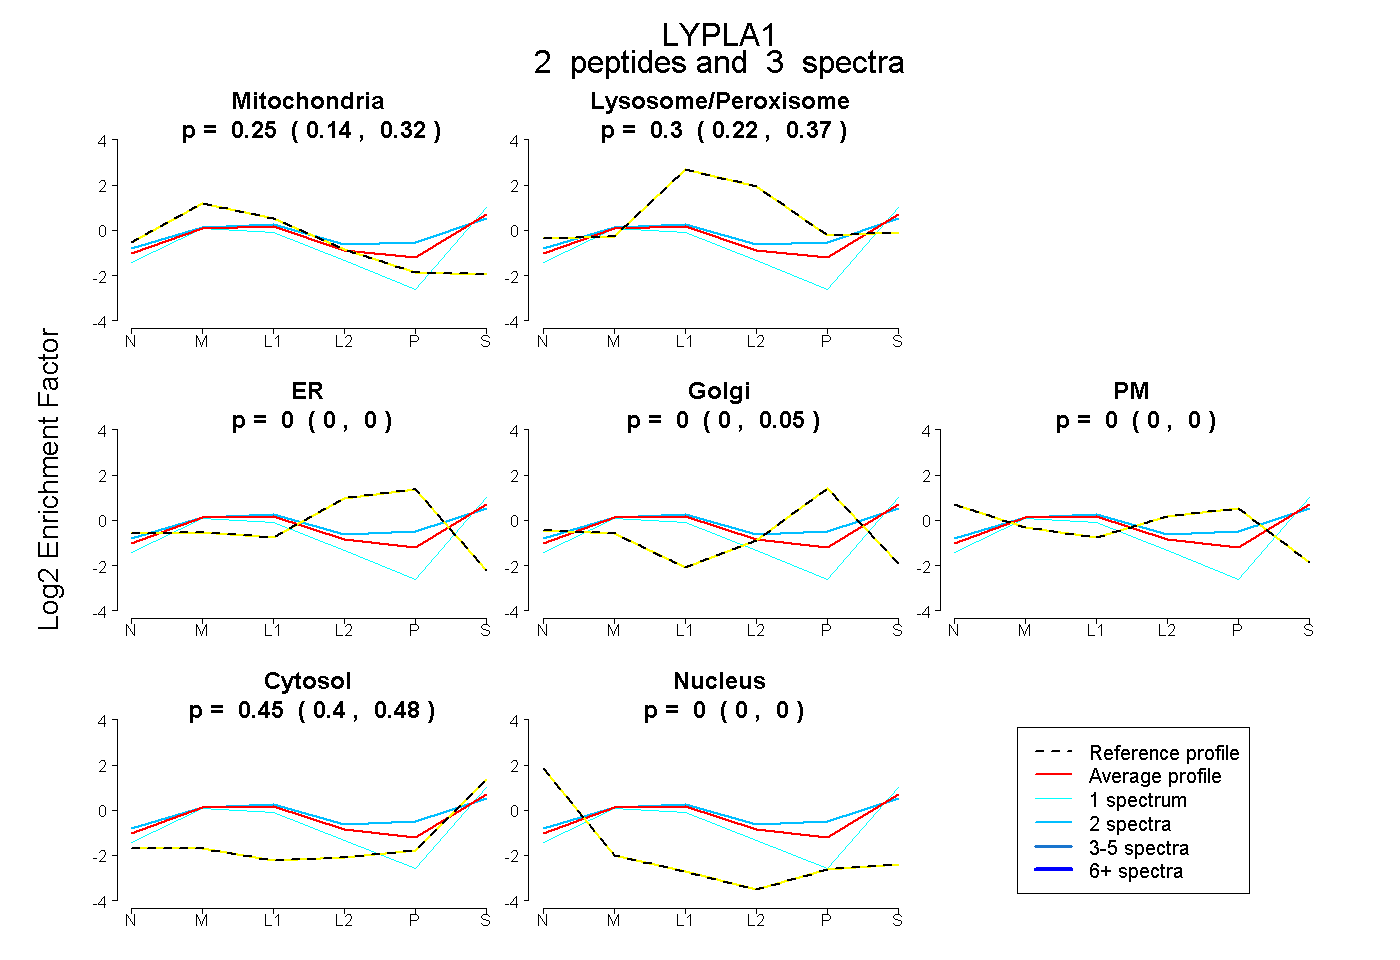
0.139 | 0.318
0.216 | 0.367
0.000 | 0.000
0.000 | 0.052
0.000 | 0.000
0.396 | 0.482
0.000 | 0.000
5peptides
spectra
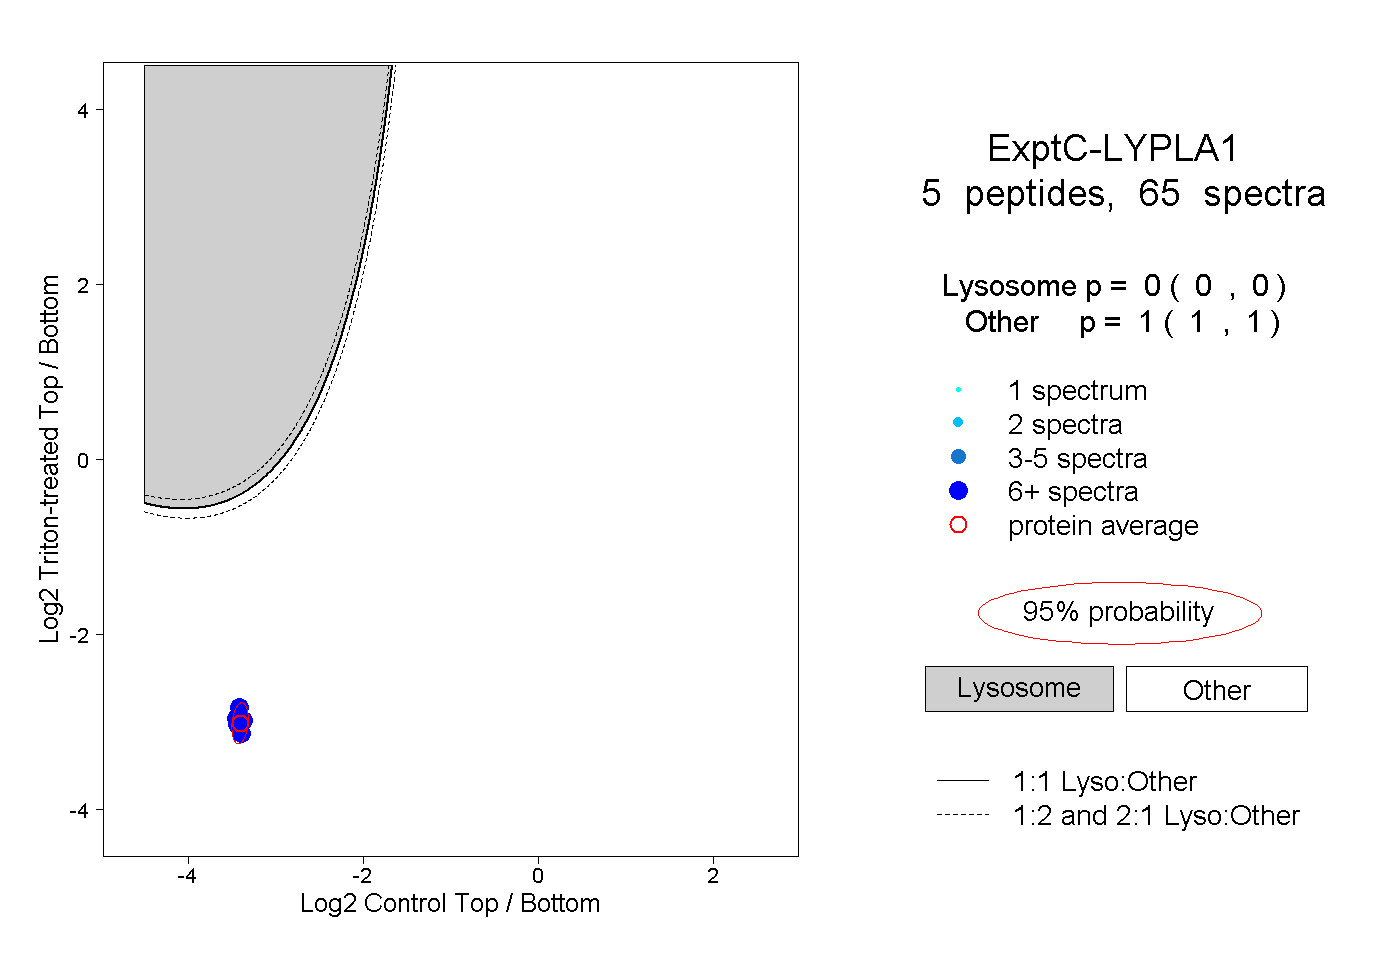
0.000 | 0.000
1.000 | 1.000
3peptides
spectra
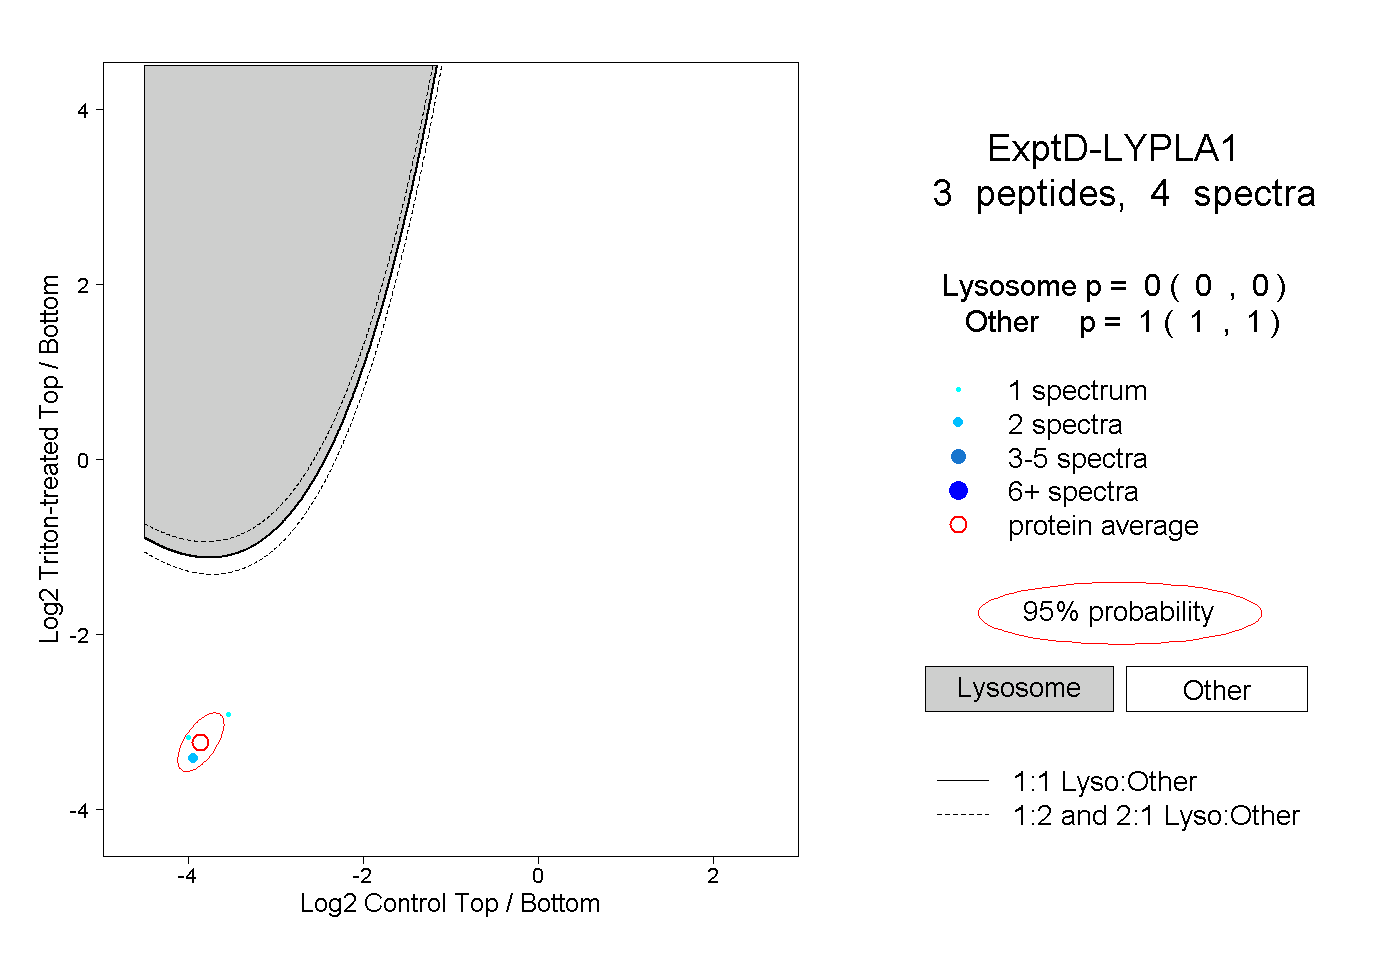
0.000 | 0.000
1.000 | 1.000