 2
2peptides
spectra
0.000 | 0.000
0.000 | 0.123
0.000 | 0.020
0.000 | 0.000
0.000 | 0.028
0.170 | 0.341
0.618 | 0.701
0.000 | 0.000
3peptides
spectra
0.000 | 0.000
1.000 | 1.000
| Plot | Mito | Lyso | Perox | ER | Golgi | PM | Cytosol | Nucleus | |||||
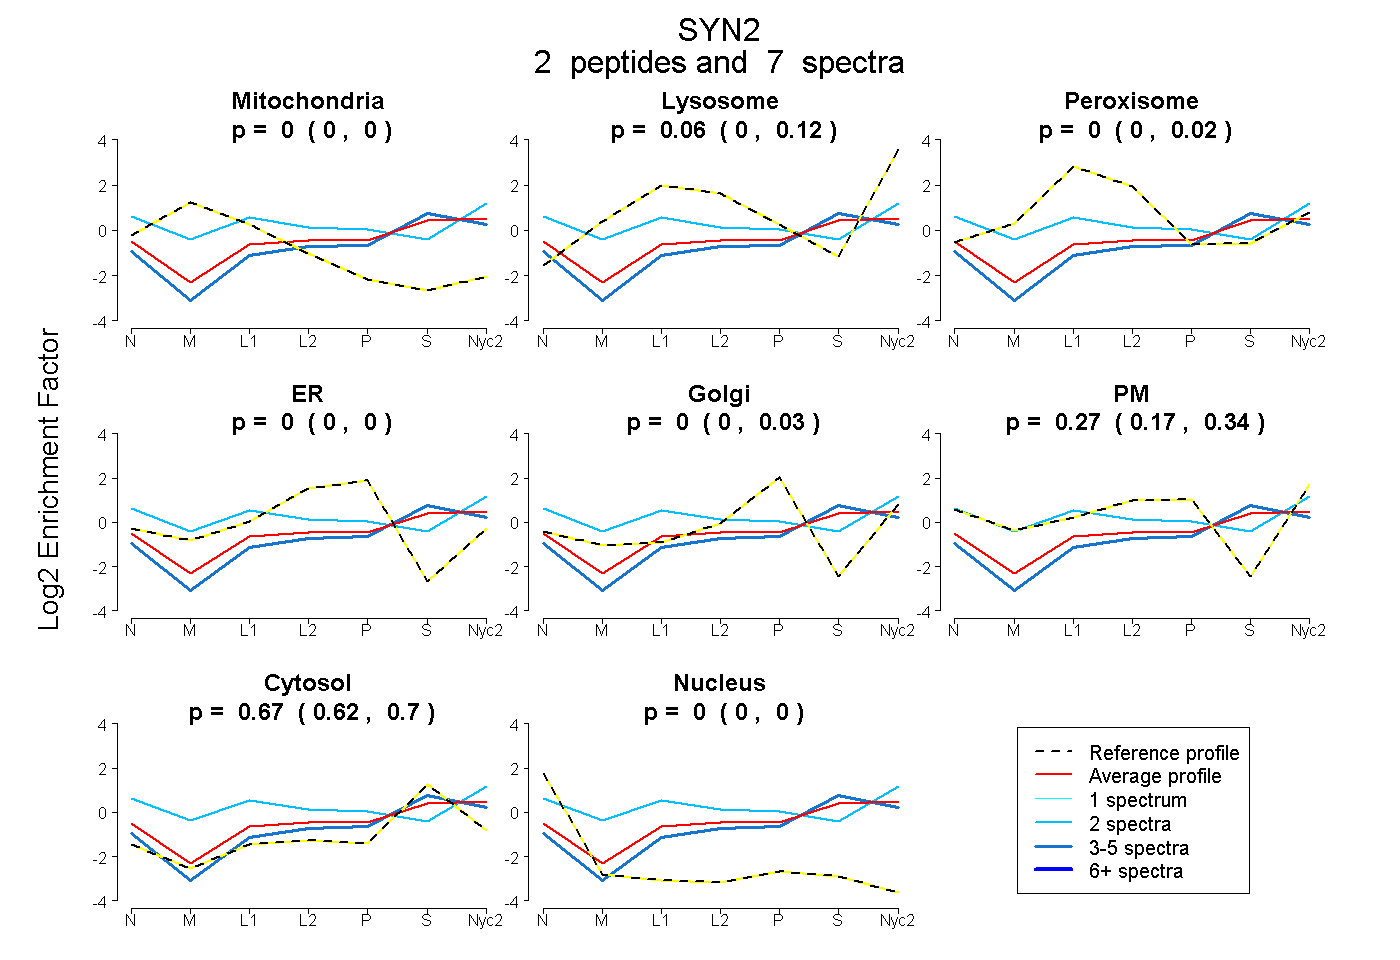
| Expt A |
2 peptides |
7 spectra |
|
0.000 0.000 | 0.000 |
0.061 0.000 | 0.123 |
0.000 0.000 | 0.020 |
0.000 0.000 | 0.000 |
0.000 0.000 | 0.028 |
0.274 0.170 | 0.341 |
0.665 0.618 | 0.701 |
0.000 0.000 | 0.000 |
||
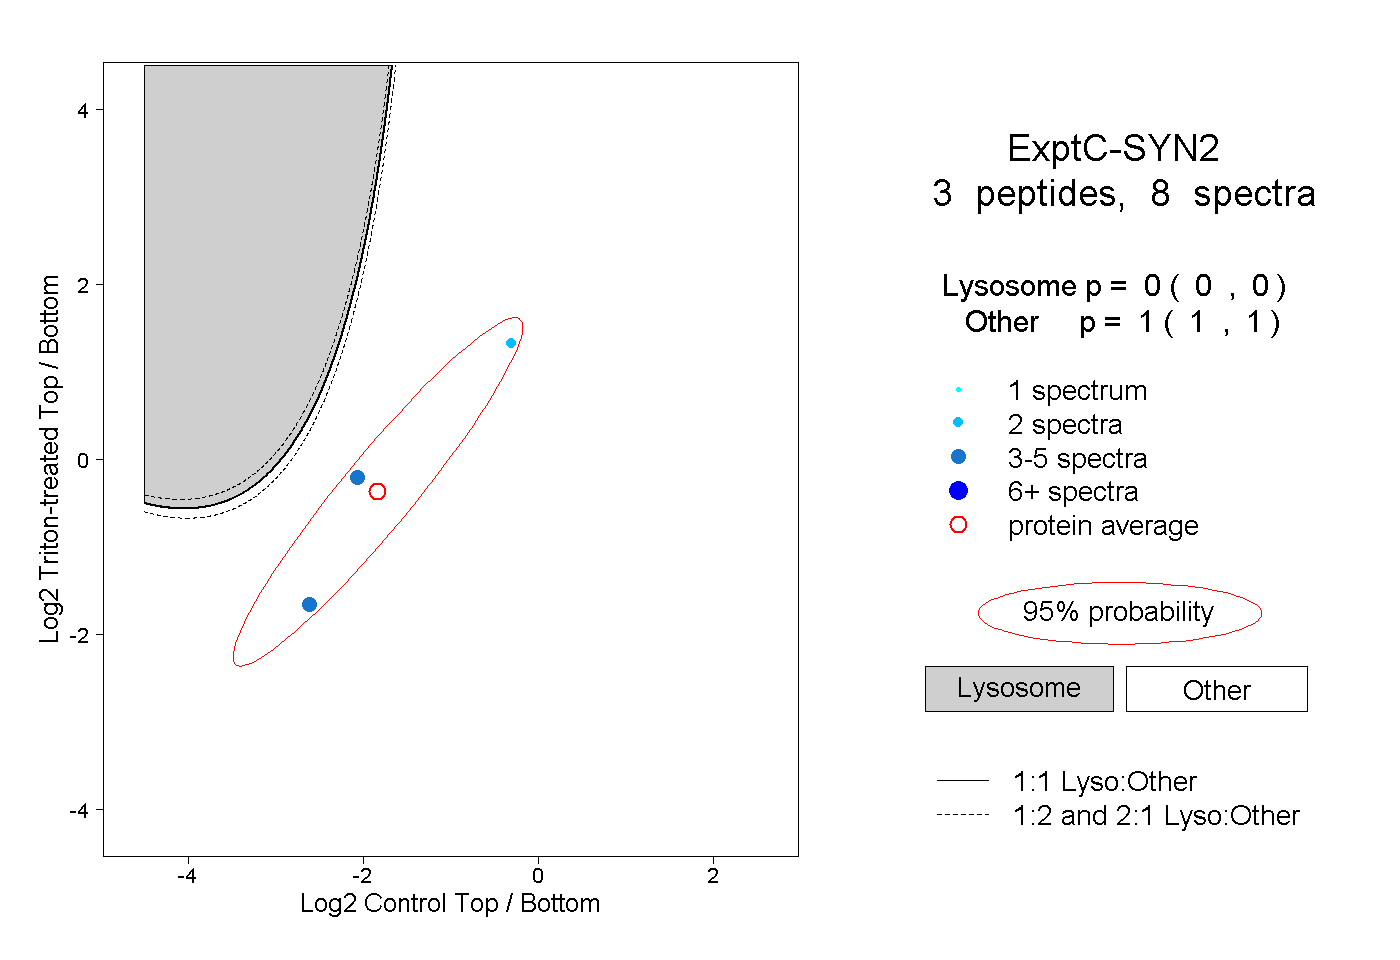
| Plot | Lyso | Other | |||||||||||
| Expt C |
3 peptides |
8 spectra |
|
0.000 0.000 | 0.000 |
1.000 1.000 | 1.000 |