 5
5peptides
spectra
0.000 | 0.000
0.176 | 0.243
0.236 | 0.325
0.094 | 0.187
0.000 | 0.000
0.298 | 0.407
0.000 | 0.000
0.000 | 0.000
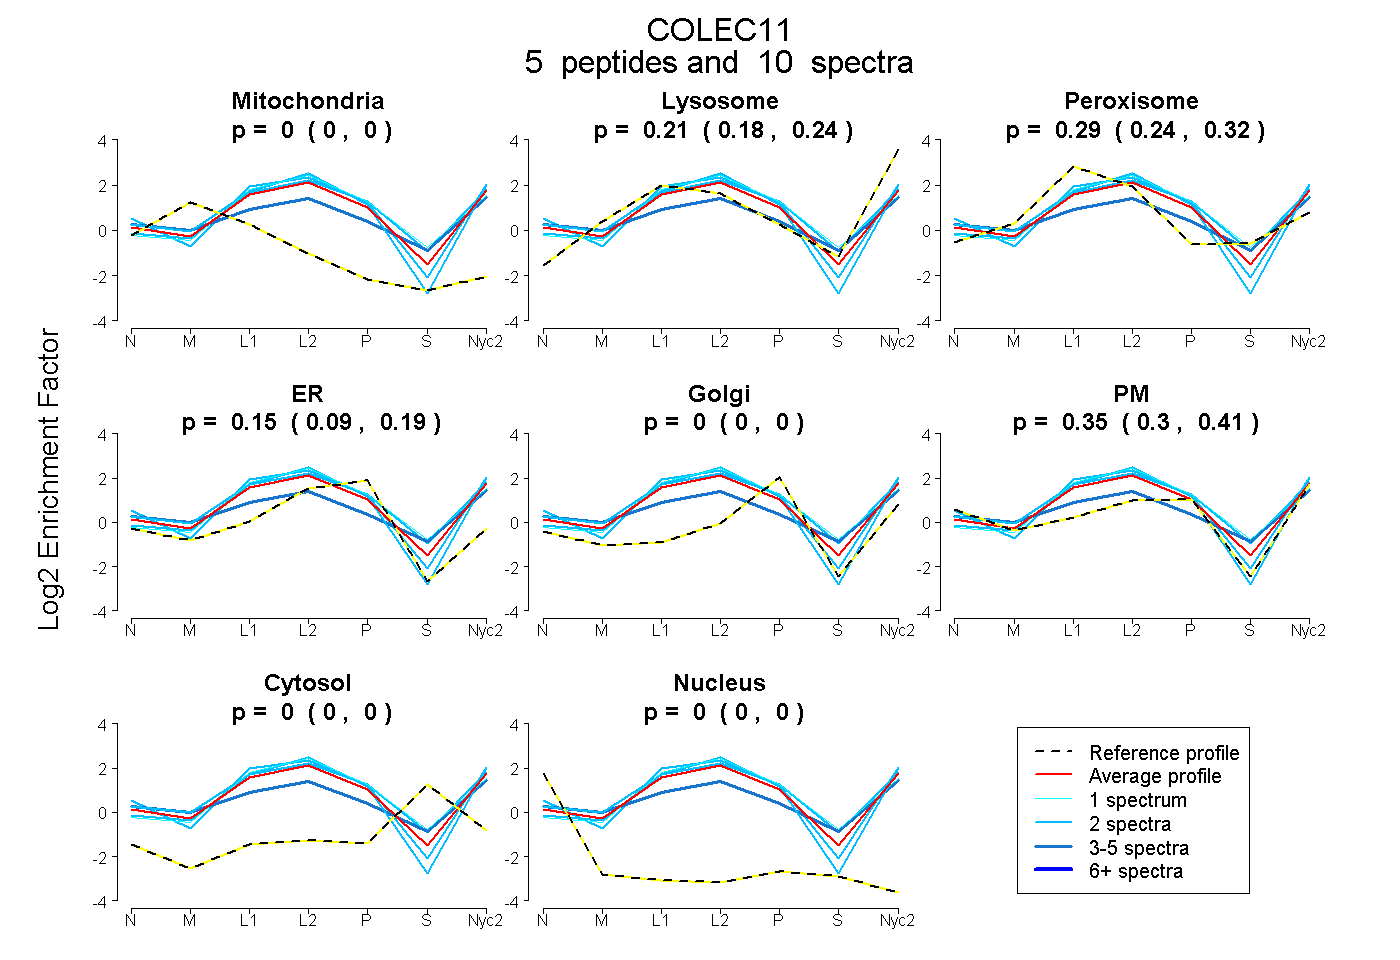
| Plot | Mito | Lyso | Perox | ER | Golgi | PM | Cytosol | Nucleus | |||||
| Expt A |
5 peptides |
10 spectra |
|
0.000 0.000 | 0.000 |
0.213 0.176 | 0.243 |
0.288 0.236 | 0.325 |
0.146 0.094 | 0.187 |
0.000 0.000 | 0.000 |
0.354 0.298 | 0.407 |
0.000 0.000 | 0.000 |
0.000 0.000 | 0.000 |
| 2 spectra, VFIGINDLER | 0.000 | 0.269 | 0.124 | 0.180 | 0.000 | 0.428 | 0.000 | 0.000 | ||
| 3 spectra, SPMQTFNK | 0.000 | 0.064 | 0.363 | 0.000 | 0.000 | 0.501 | 0.072 | 0.000 | ||
| 2 spectra, GGTLSMPK | 0.000 | 0.351 | 0.271 | 0.270 | 0.000 | 0.108 | 0.000 | 0.000 | ||
| 2 spectra, EGAFVYSDR | 0.000 | 0.177 | 0.236 | 0.079 | 0.000 | 0.509 | 0.000 | 0.000 | ||
| 1 spectrum, YADAQLSCQGR | 0.000 | 0.312 | 0.352 | 0.336 | 0.000 | 0.000 | 0.000 | 0.000 |
| Plot | Mito | Lyso or Perox | ER | Golgi | PM | Cytosol | Nucleus | ||||||
| Expt B |
2 peptides |
3 spectra |
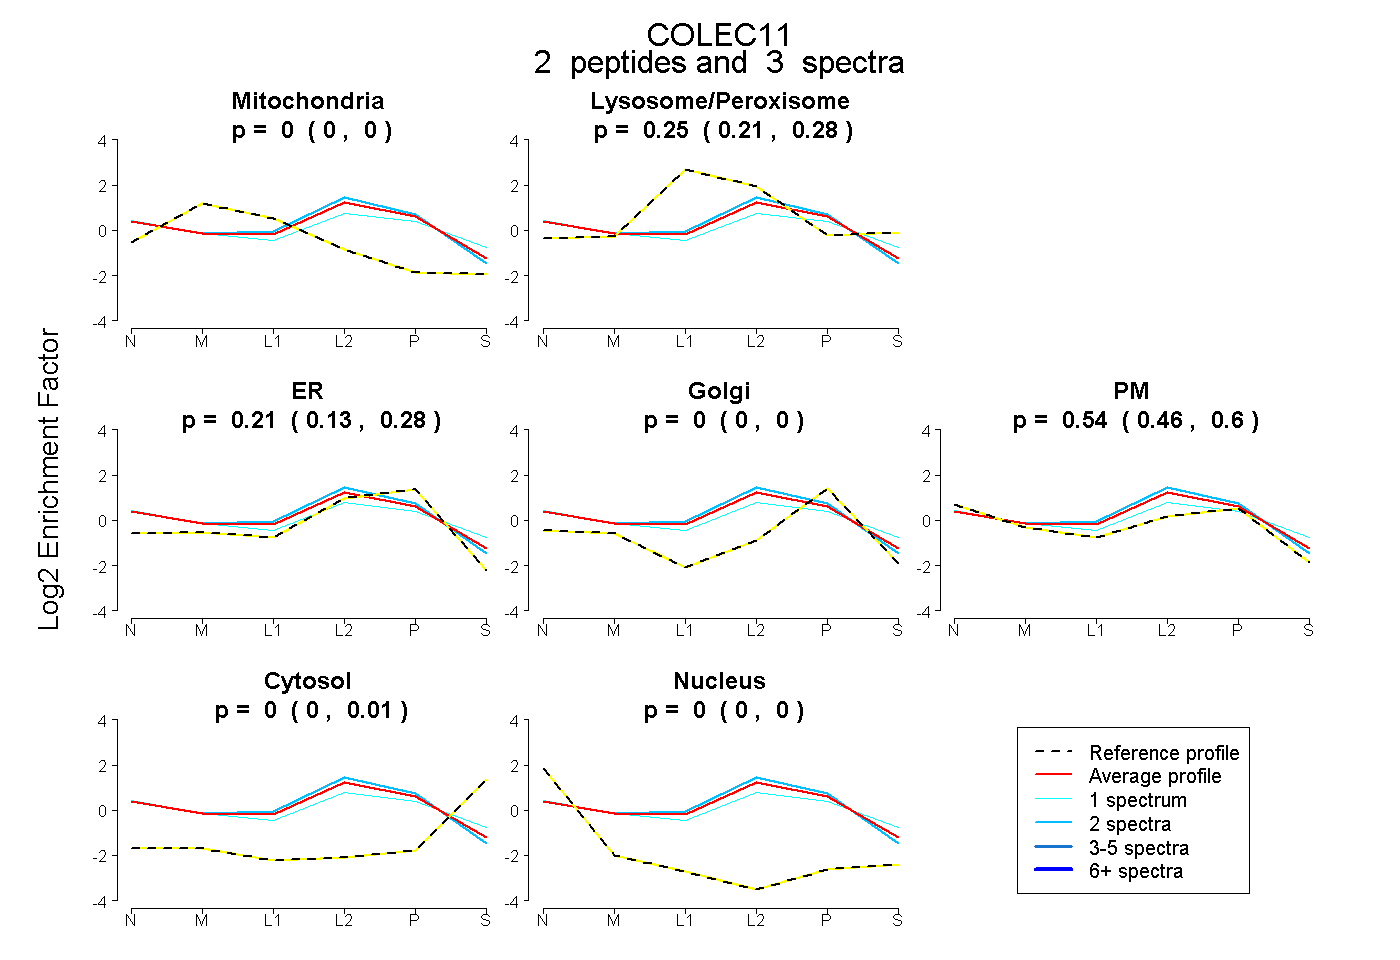 |
0.000 0.000 | 0.000 |
0.250 0.208 | 0.285 |
0.211 0.130 | 0.277 |
0.000 0.000 | 0.000 |
0.539 0.457 | 0.603 |
0.000 0.000 | 0.007 |
0.000 0.000 | 0.000 |
|||
| Plot | Lyso | Other | |||||||||||
| Expt C |
5 peptides |
41 spectra |
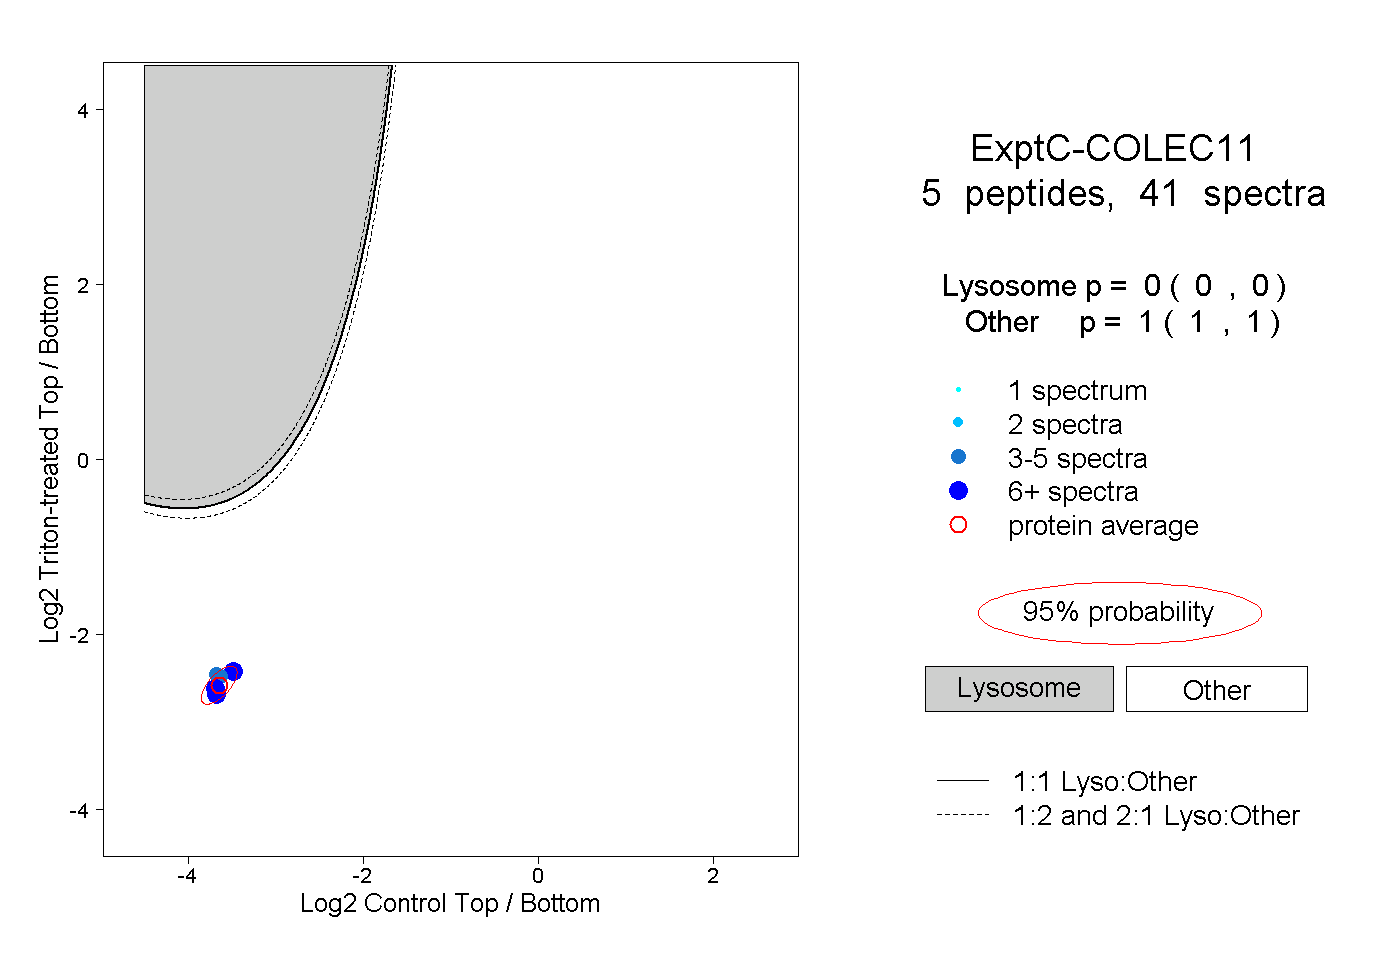 |
0.000 0.000 | 0.000 |
1.000 1.000 | 1.000 |