 3
3peptides
spectra
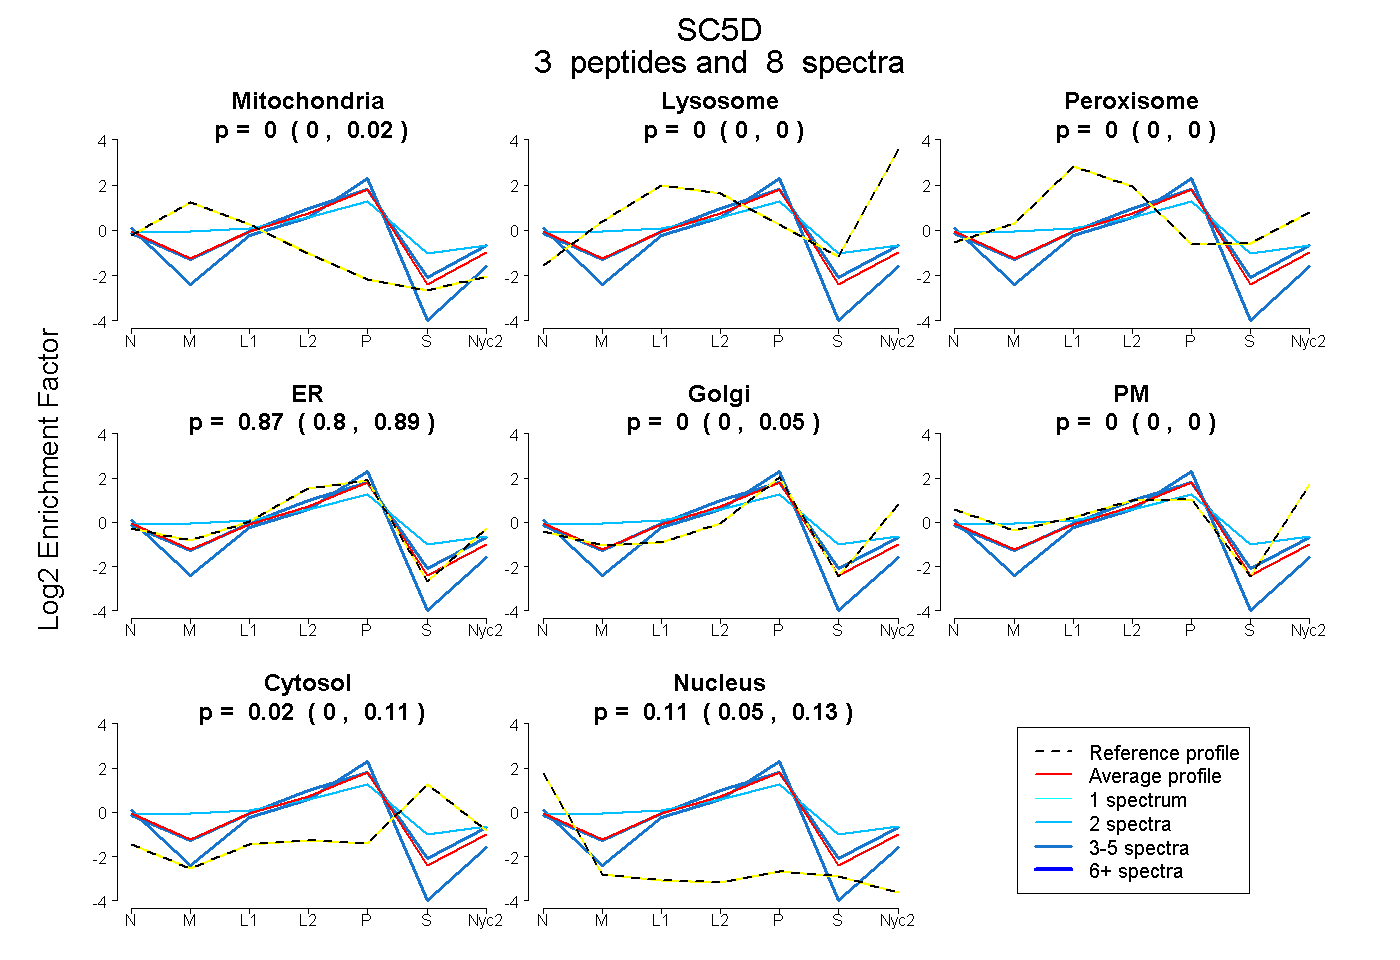
0.000 | 0.022
0.000 | 0.000
0.000 | 0.000
0.803 | 0.887
0.000 | 0.055
0.000 | 0.000
0.000 | 0.110
0.050 | 0.131
5peptides
spectra
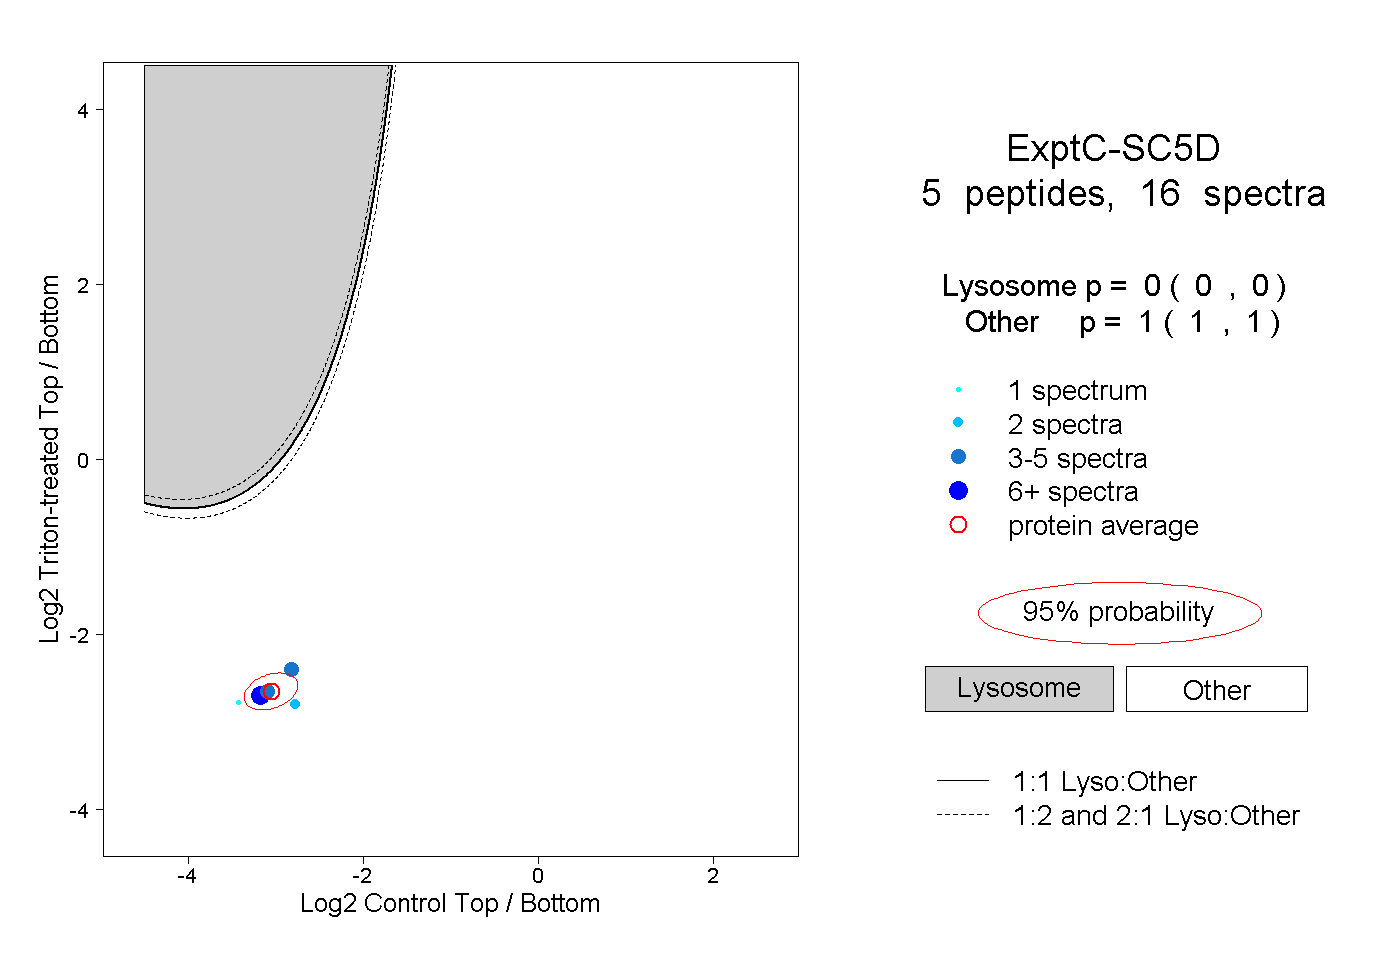
0.000 | 0.000
1.000 | 1.000
1peptide
spectra
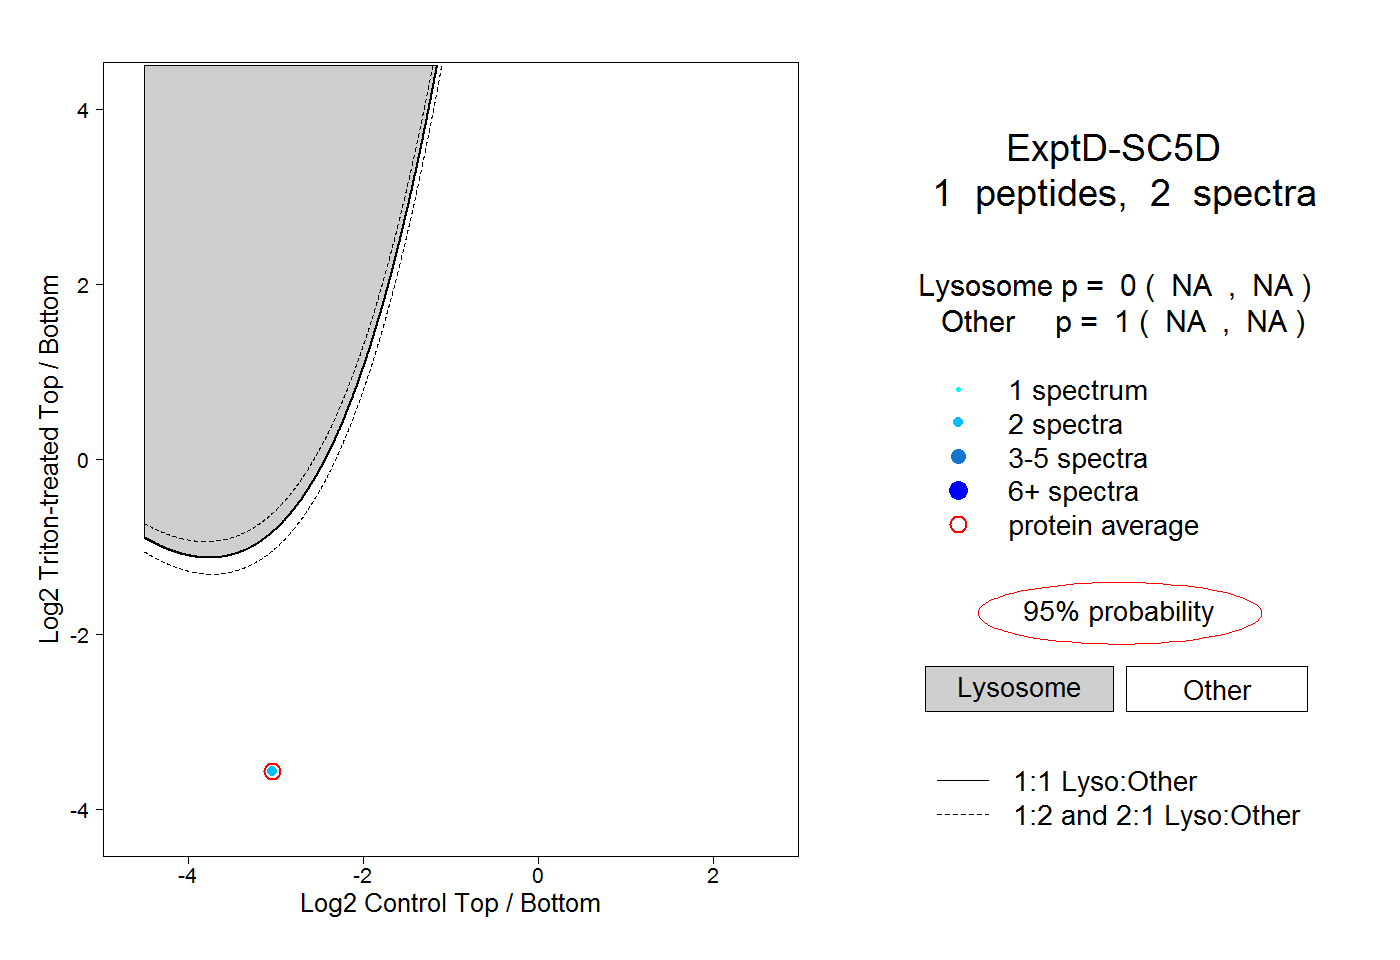
NA | NA
NA | NA