14
14peptides
spectra
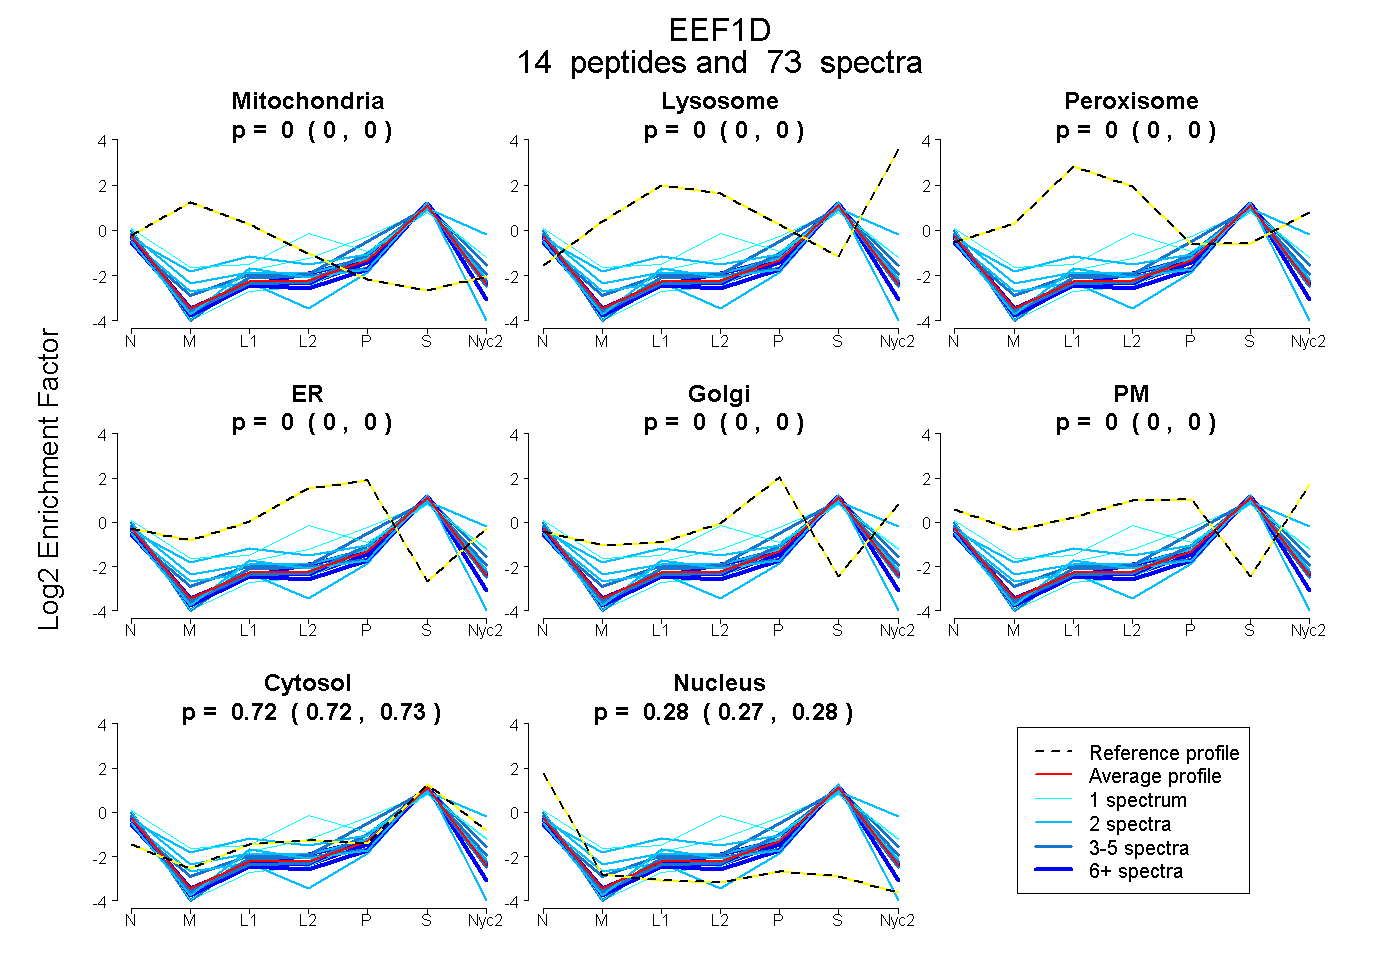
0.000 | 0.000
0.000 | 0.000
0.000 | 0.000
0.000 | 0.000
0.000 | 0.000
0.000 | 0.000
0.720 | 0.728
0.271 | 0.279
5peptides
spectra
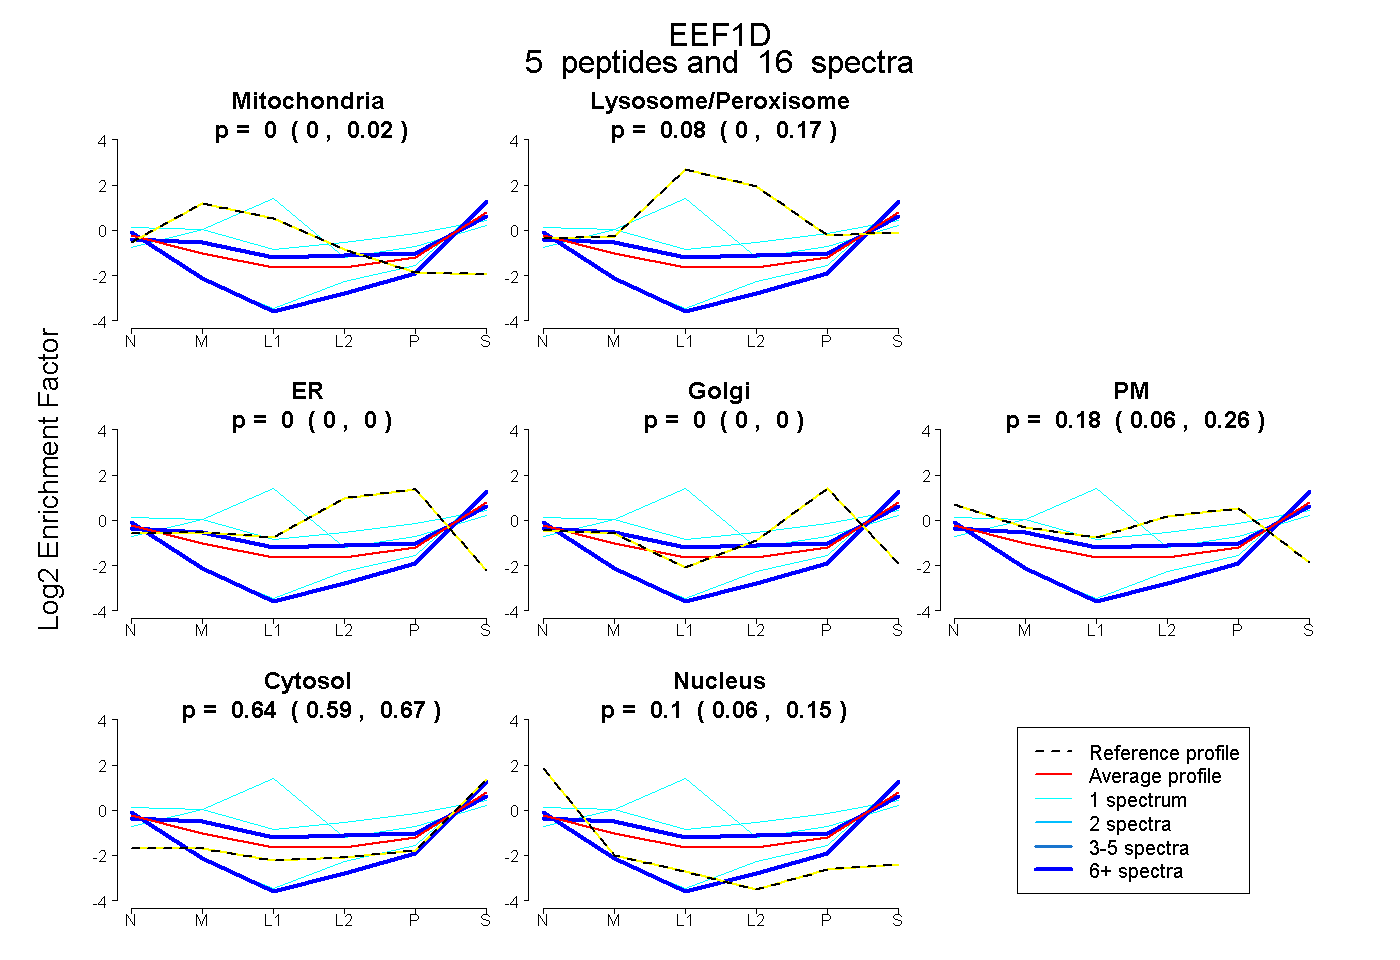
0.000 | 0.019
0.000 | 0.165
0.000 | 0.000
0.000 | 0.000
0.064 | 0.259
0.589 | 0.674
0.056 | 0.151