 14
14peptides
spectra
0.000 | 0.000
0.000 | 0.000
0.000 | 0.000
0.000 | 0.000
0.000 | 0.000
0.000 | 0.000
0.720 | 0.728
0.271 | 0.279
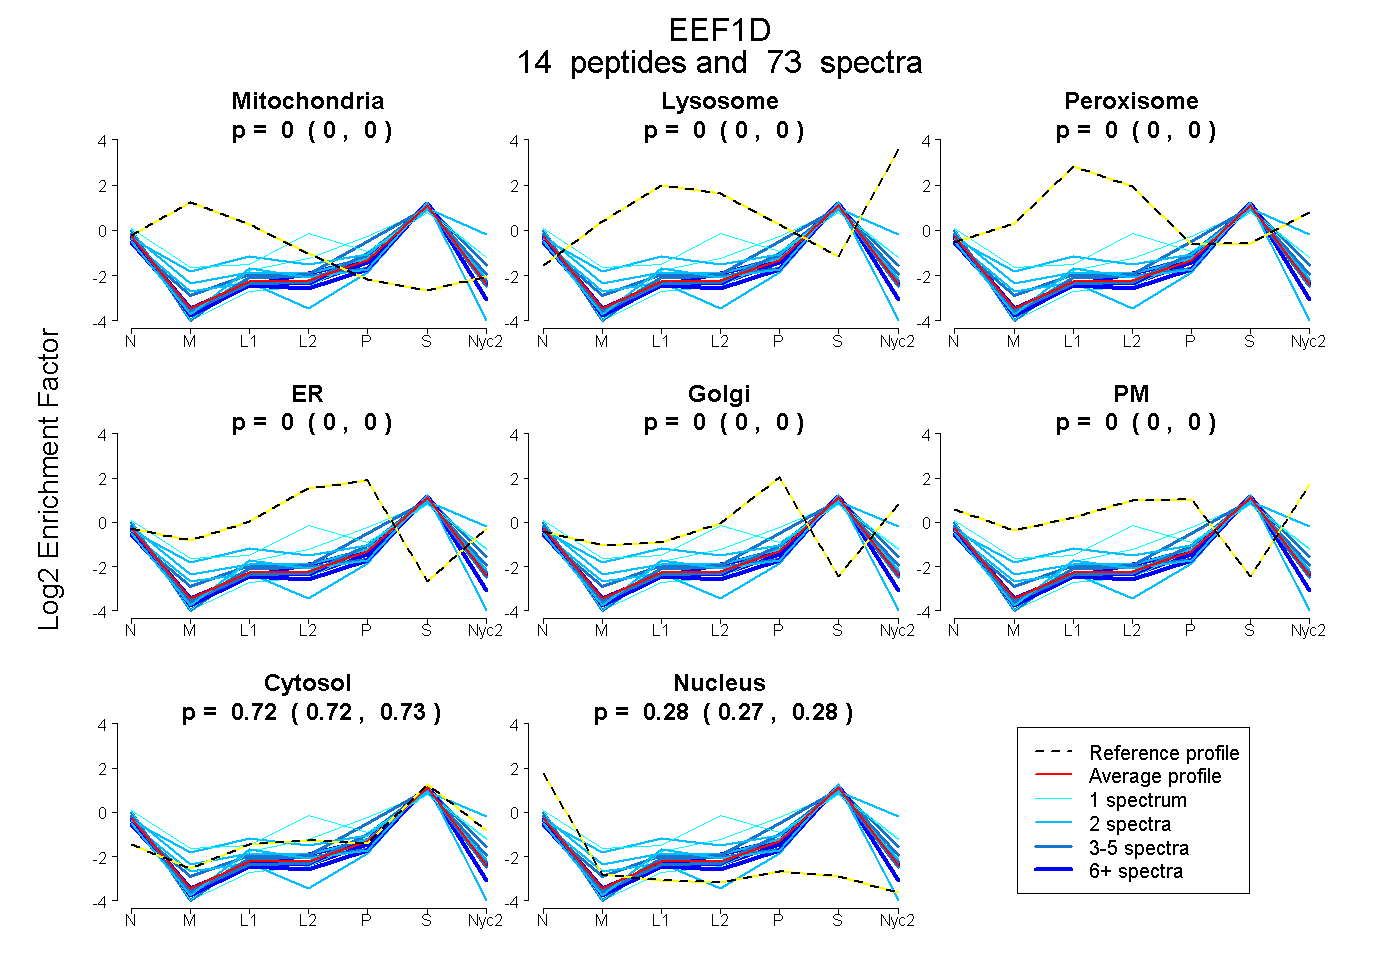
| Plot | Mito | Lyso | Perox | ER | Golgi | PM | Cytosol | Nucleus | |||||
| Expt A |
14 peptides |
73 spectra |
|
0.000 0.000 | 0.000 |
0.000 0.000 | 0.000 |
0.000 0.000 | 0.000 |
0.000 0.000 | 0.000 |
0.000 0.000 | 0.000 |
0.000 0.000 | 0.000 |
0.725 0.720 | 0.728 |
0.275 0.271 | 0.279 |
| 1 spectrum, YDDAER | 0.000 | 0.000 | 0.111 | 0.131 | 0.000 | 0.000 | 0.639 | 0.119 | ||
| 20 spectra, LVPVGYGIR | 0.000 | 0.000 | 0.000 | 0.000 | 0.000 | 0.000 | 0.647 | 0.353 | ||
| 21 spectra, ATAPQTQHVSPMR | 0.000 | 0.000 | 0.000 | 0.000 | 0.000 | 0.000 | 0.713 | 0.287 | ||
| 4 spectra, QYAEK | 0.000 | 0.000 | 0.000 | 0.000 | 0.000 | 0.000 | 0.699 | 0.301 | ||
| 2 spectra, SIQLDGLVWGASK | 0.000 | 0.000 | 0.000 | 0.000 | 0.000 | 0.165 | 0.801 | 0.034 | ||
| 4 spectra, QVEPPAK | 0.000 | 0.000 | 0.000 | 0.000 | 0.000 | 0.000 | 0.776 | 0.224 | ||
| 2 spectra, SLAGSSGPGASSGPGGDHSDLIVR | 0.000 | 0.000 | 0.000 | 0.000 | 0.000 | 0.000 | 0.660 | 0.340 | ||
| 3 spectra, ATNFLMHEK | 0.000 | 0.000 | 0.000 | 0.000 | 0.000 | 0.000 | 0.835 | 0.165 | ||
| 1 spectrum, ISTLEK | 0.000 | 0.000 | 0.000 | 0.000 | 0.088 | 0.000 | 0.775 | 0.137 | ||
| 2 spectra, LQIQCVVEDDK | 0.000 | 0.000 | 0.000 | 0.000 | 0.000 | 0.000 | 0.579 | 0.421 | ||
| 1 spectrum, GVVQDLQQAISK | 0.000 | 0.000 | 0.000 | 0.000 | 0.000 | 0.000 | 0.572 | 0.428 | ||
| 2 spectra, KPTLVAK | 0.000 | 0.000 | 0.000 | 0.000 | 0.000 | 0.000 | 0.751 | 0.249 | ||
| 6 spectra, FYEQMNGPVTAGSR | 0.000 | 0.000 | 0.000 | 0.000 | 0.000 | 0.000 | 0.765 | 0.235 | ||
| 4 spectra, IASLEVENQNLR | 0.000 | 0.000 | 0.000 | 0.000 | 0.000 | 0.000 | 0.711 | 0.289 |
| Plot | Mito | Lyso or Perox | ER | Golgi | PM | Cytosol | Nucleus | ||||||
| Expt B |
5 peptides |
16 spectra |
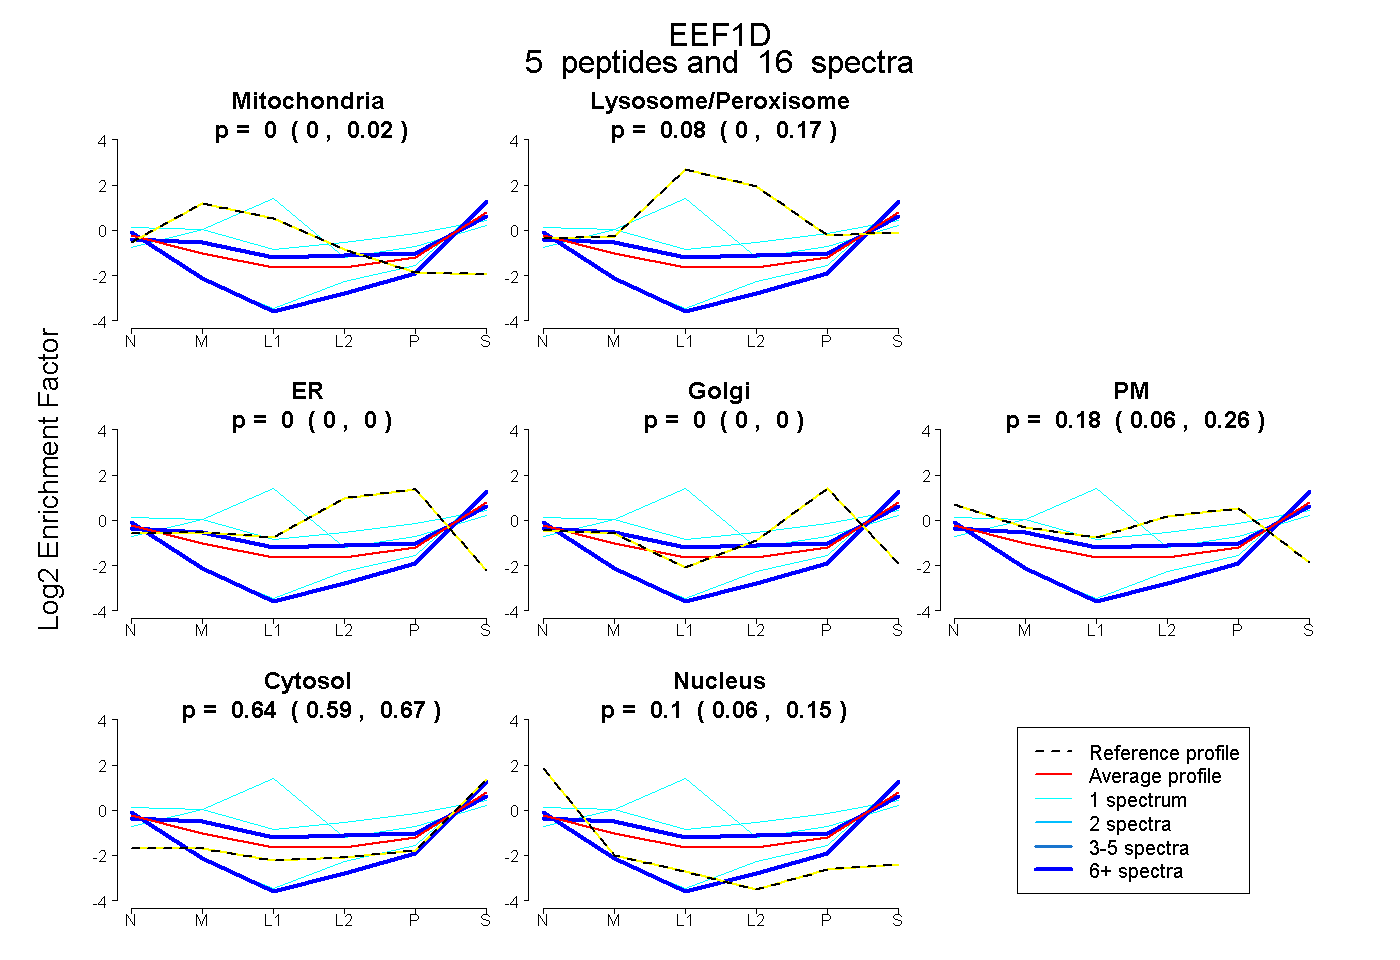 |
0.000 0.000 | 0.019 |
0.079 0.000 | 0.165 |
0.000 0.000 | 0.000 |
0.000 0.000 | 0.000 |
0.179 0.064 | 0.259 |
0.638 0.589 | 0.674 |
0.105 0.056 | 0.151 |
|||
| Plot | Lyso | Other | |||||||||||
| Expt C |
8 peptides |
36 spectra |
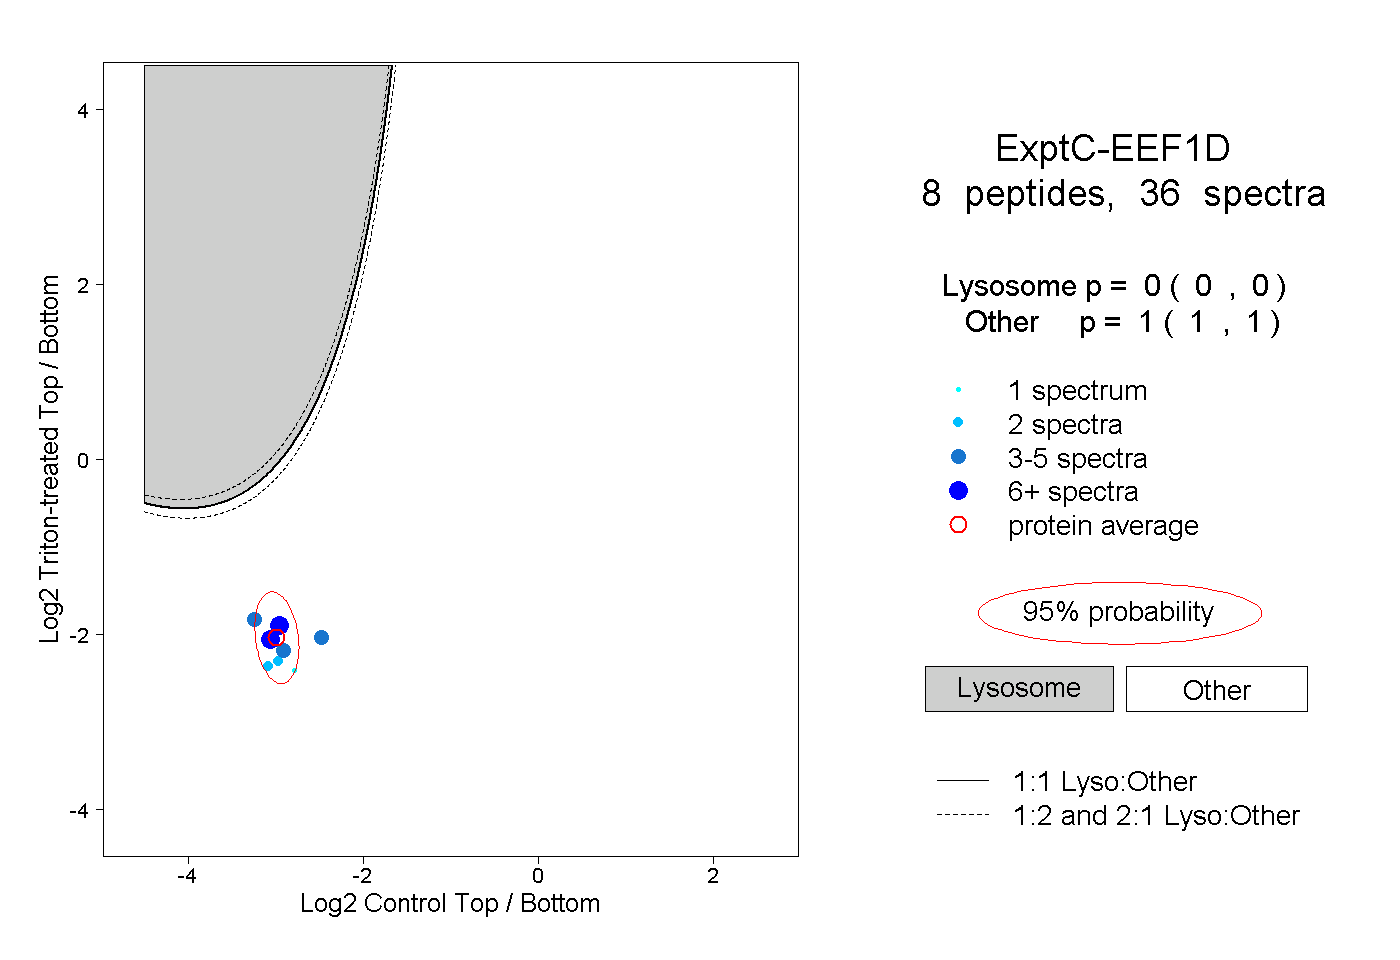 |
0.000 0.000 | 0.000 |
1.000 1.000 | 1.000 |
||||||||
| Plot | Lyso | Other | |||||||||||
| Expt D |
1 peptide |
4 spectra |
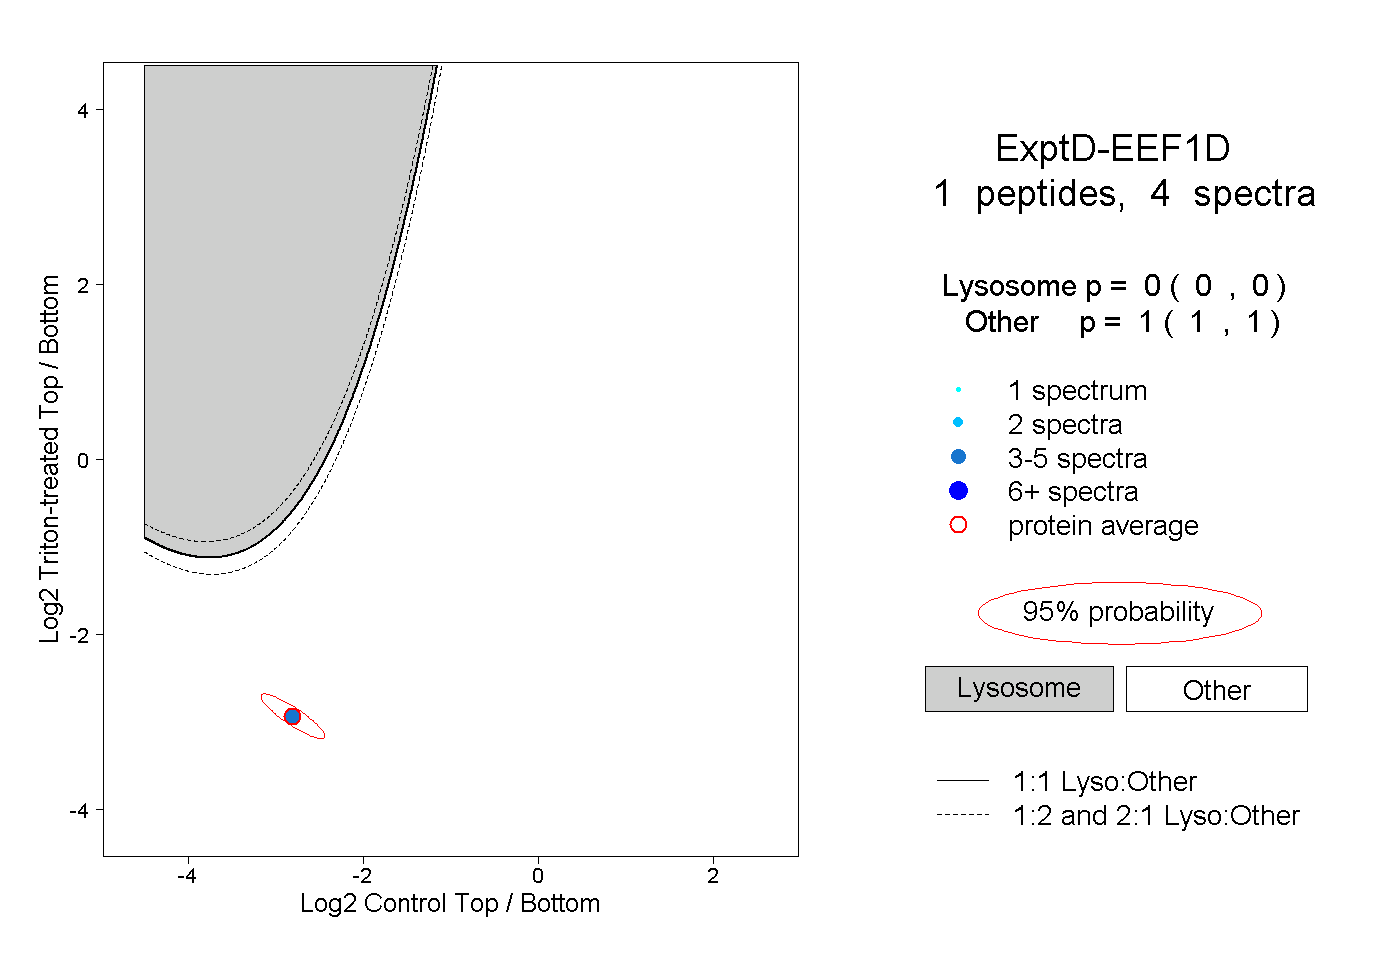 |
0.000 0.000 | 0.000 |
1.000 1.000 | 1.000 |