 4
4peptides
spectra
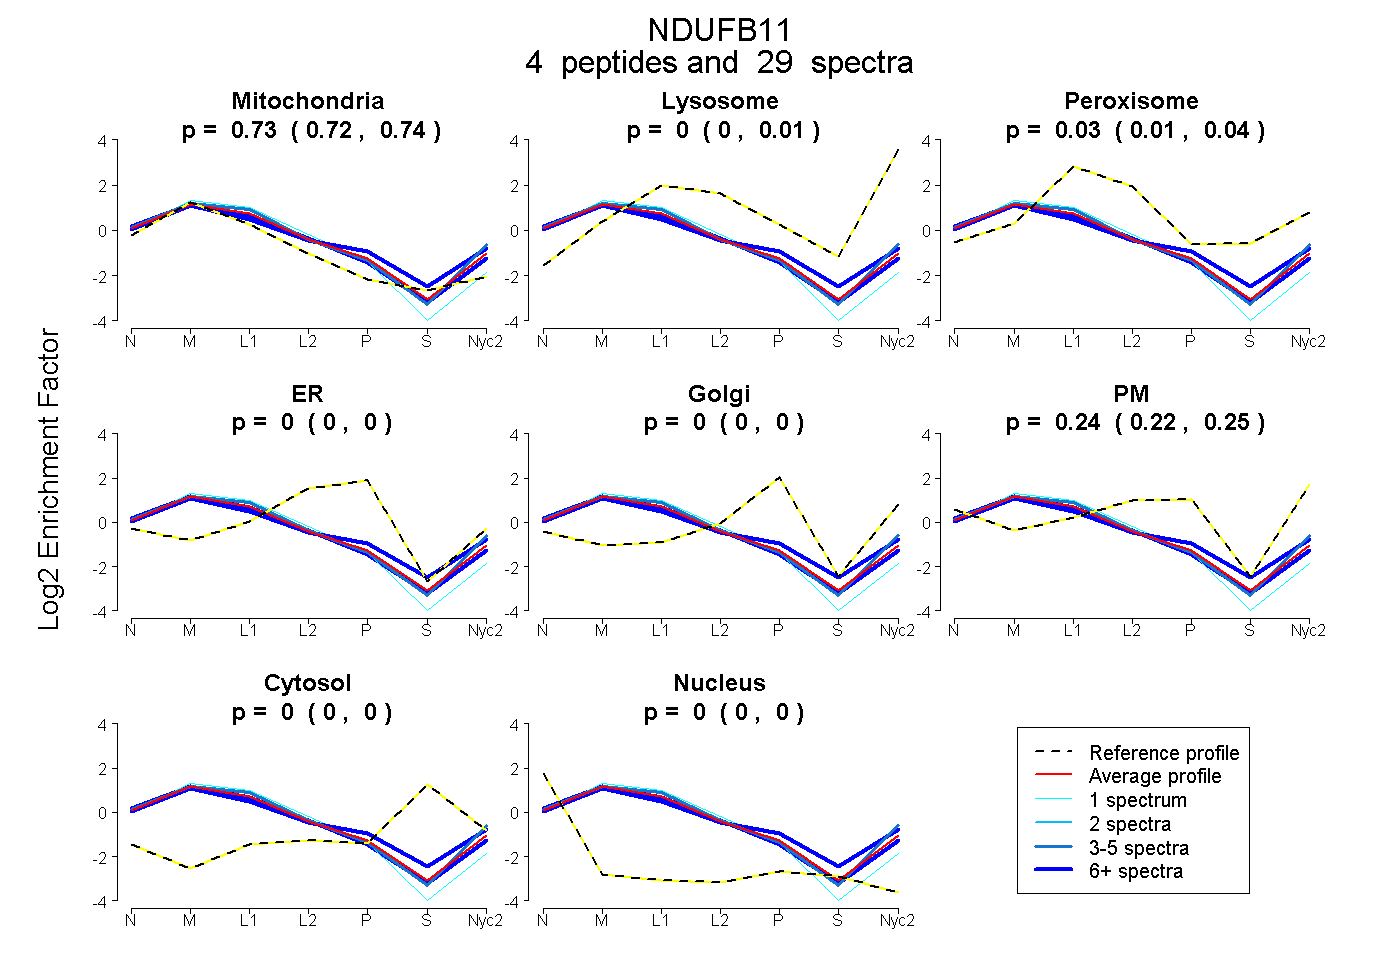
0.721 | 0.741
0.000 | 0.011
0.012 | 0.044
0.000 | 0.000
0.000 | 0.000
0.221 | 0.249
0.000 | 0.000
0.000 | 0.000
1peptide
spectra
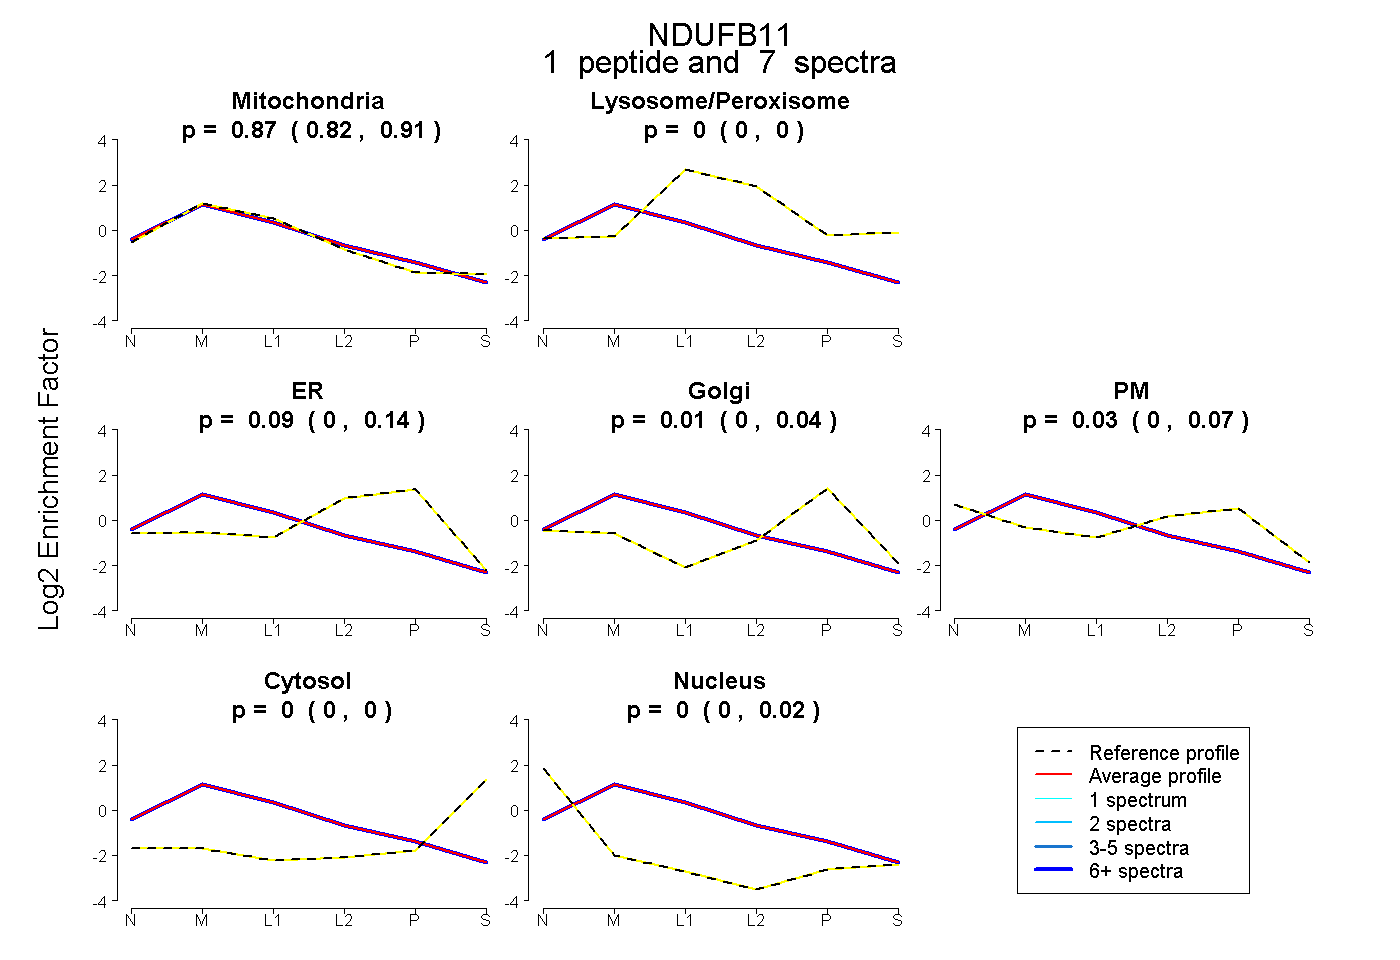
0.824 | 0.906
0.000 | 0.002
0.000 | 0.140
0.000 | 0.042
0.000 | 0.068
0.000 | 0.000
0.000 | 0.017
4peptides
spectra
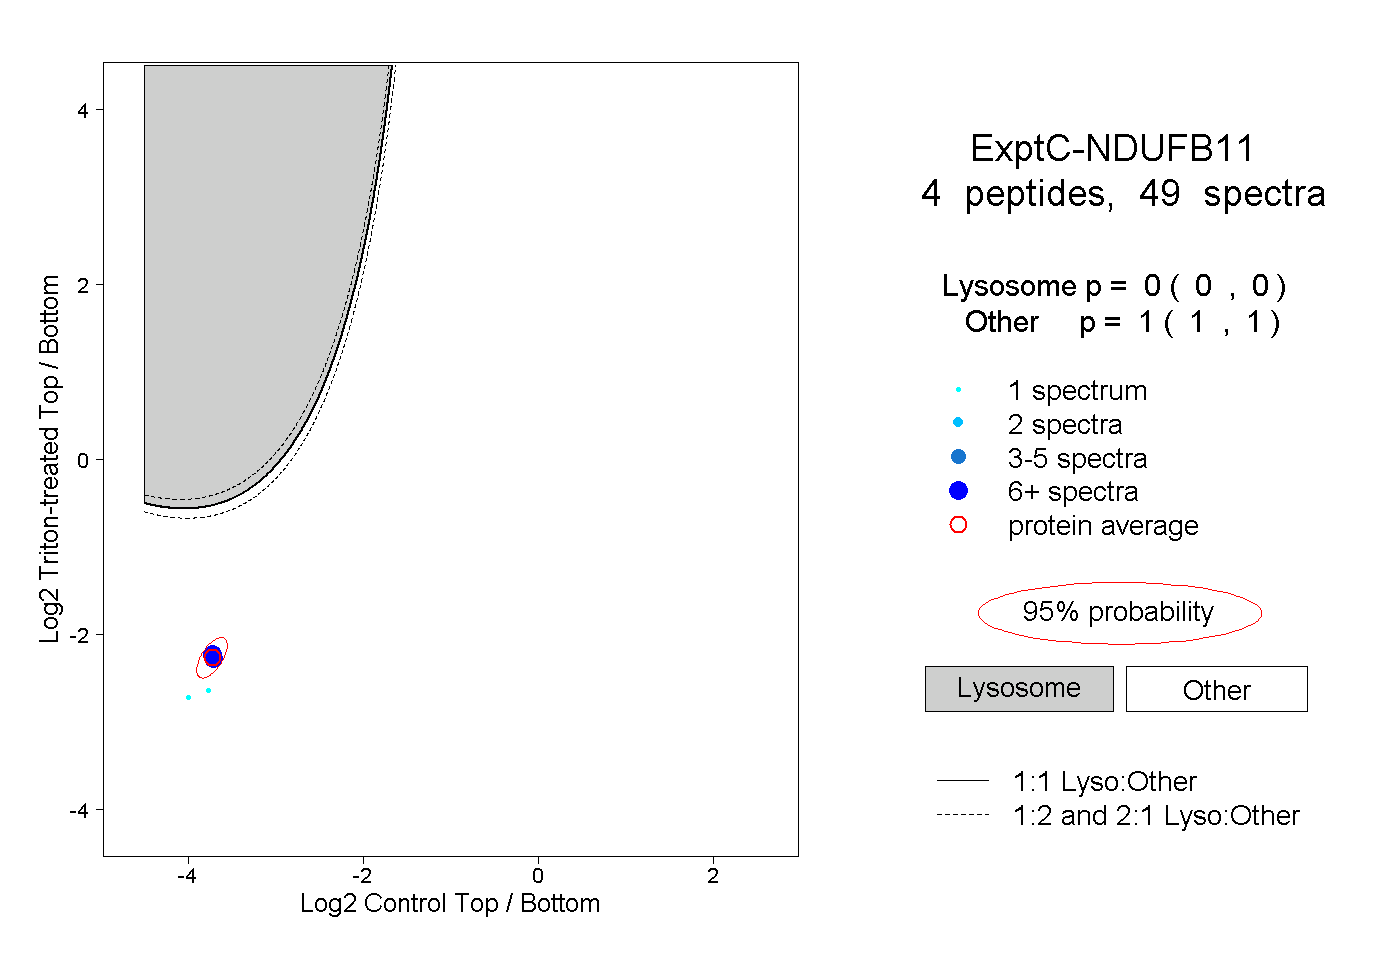
0.000 | 0.000
1.000 | 1.000
5peptides
spectra
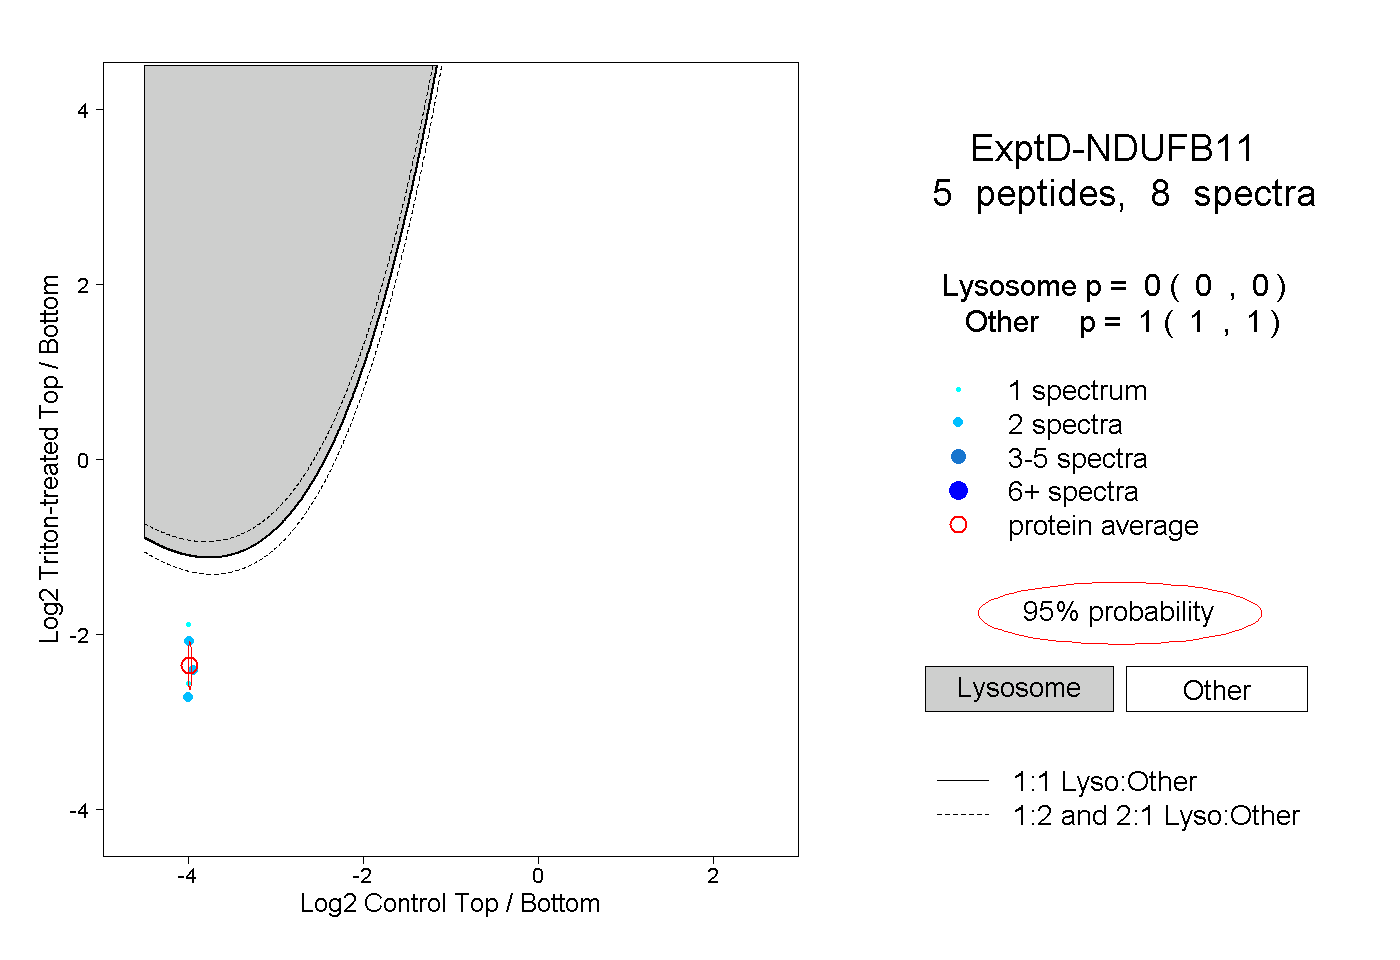
0.000 | 0.000
1.000 | 1.000