 3
3peptides
spectra
0.120 | 0.489
0.000 | 0.192
0.000 | 0.184
0.000 | 0.000
0.000 | 0.285
0.000 | 0.172
0.146 | 0.492
0.000 | 0.082
2peptides
spectra
0.000 | 0.009
0.991 | 1.000
| Plot | Mito | Lyso | Perox | ER | Golgi | PM | Cytosol | Nucleus | |||||
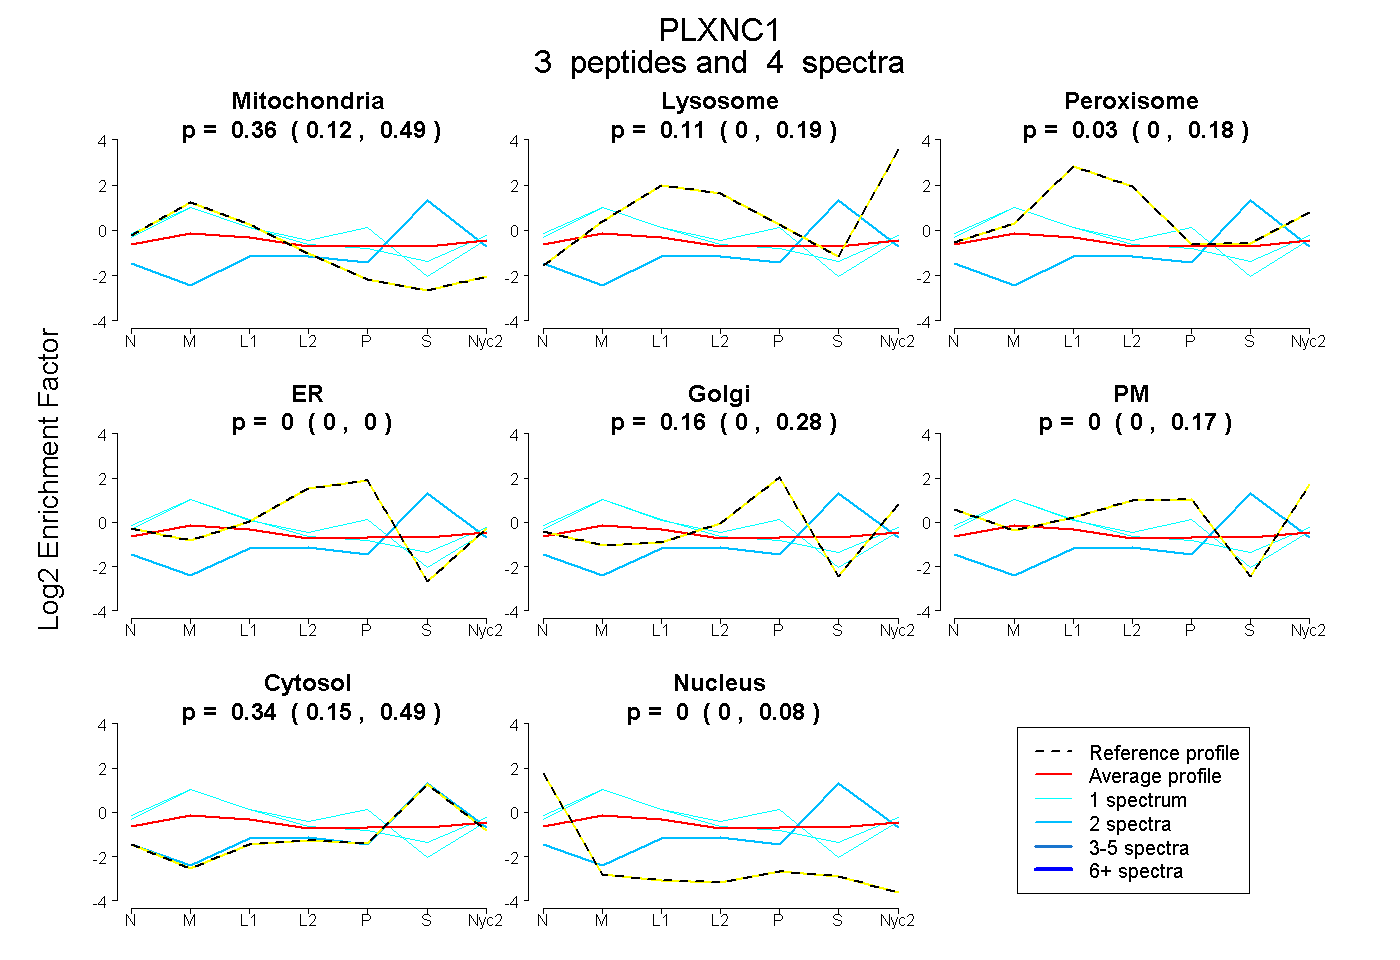
| Expt A |
3 peptides |
4 spectra |
|
0.358 0.120 | 0.489 |
0.109 0.000 | 0.192 |
0.032 0.000 | 0.184 |
0.000 0.000 | 0.000 |
0.161 0.000 | 0.285 |
0.000 0.000 | 0.172 |
0.339 0.146 | 0.492 |
0.000 0.000 | 0.082 |
||
| Plot | Lyso | Other | |||||||||||
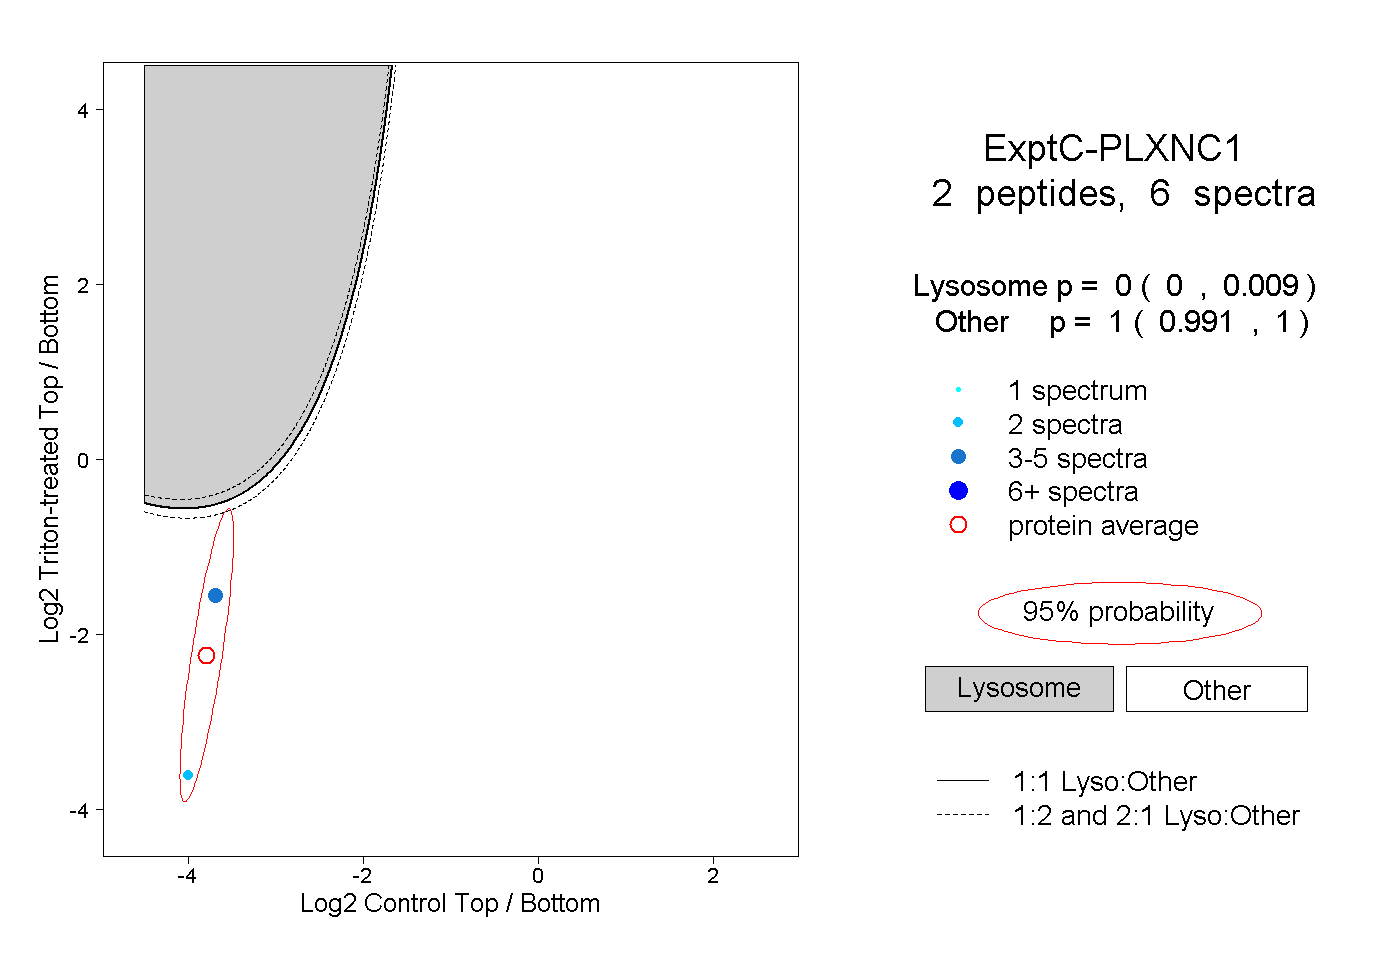
| Expt C |
2 peptides |
6 spectra |
|
0.000 0.000 | 0.009 |
1.000 0.991 | 1.000 |