PRG2
[ENSRNOP00000011168]
Main page
| | | Plot |
Mito |
Lyso |
|
Perox |
ER |
Golgi |
PM |
Cytosol |
Nucleus |
|
| Expt A |
 7
7
peptides |
28
spectra |
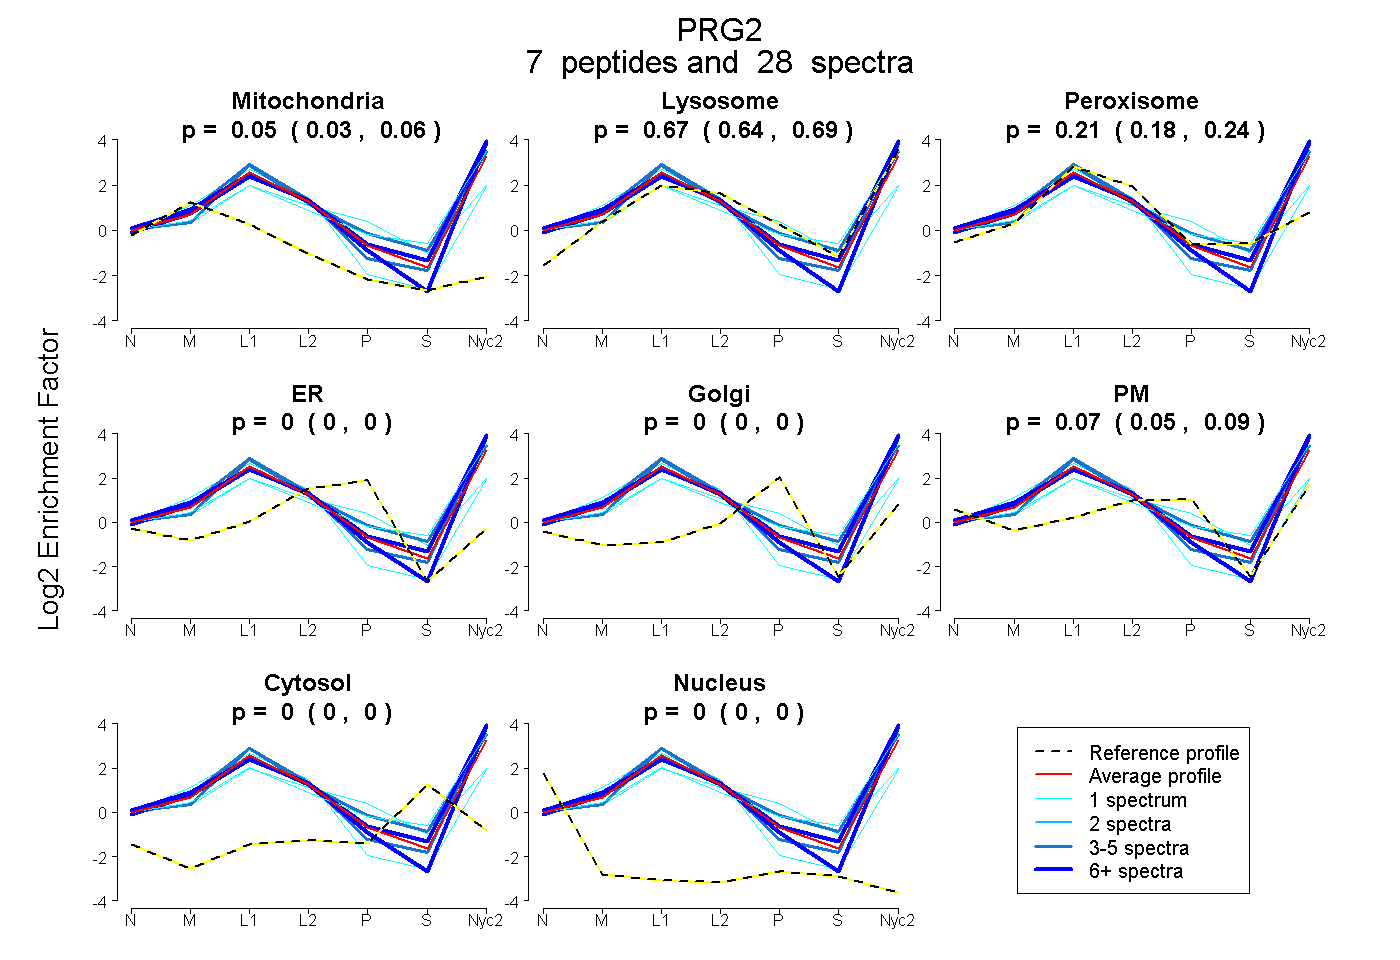 |
0.046
0.031 | 0.059 |
0.668
0.635 | 0.694 |
|
0.212
0.178 | 0.239 |
0.000
0.000 | 0.000 |
0.000
0.000 | 0.000 |
0.073
0.050 | 0.091 |
0.000
0.000 | 0.000 |
0.000
0.000 | 0.000 |
|
| | | Plot |
Mito |
|
Lyso or Perox |
|
ER |
Golgi |
PM |
Cytosol |
Nucleus |
|
| Expt B |
7
peptides |
12
spectra |
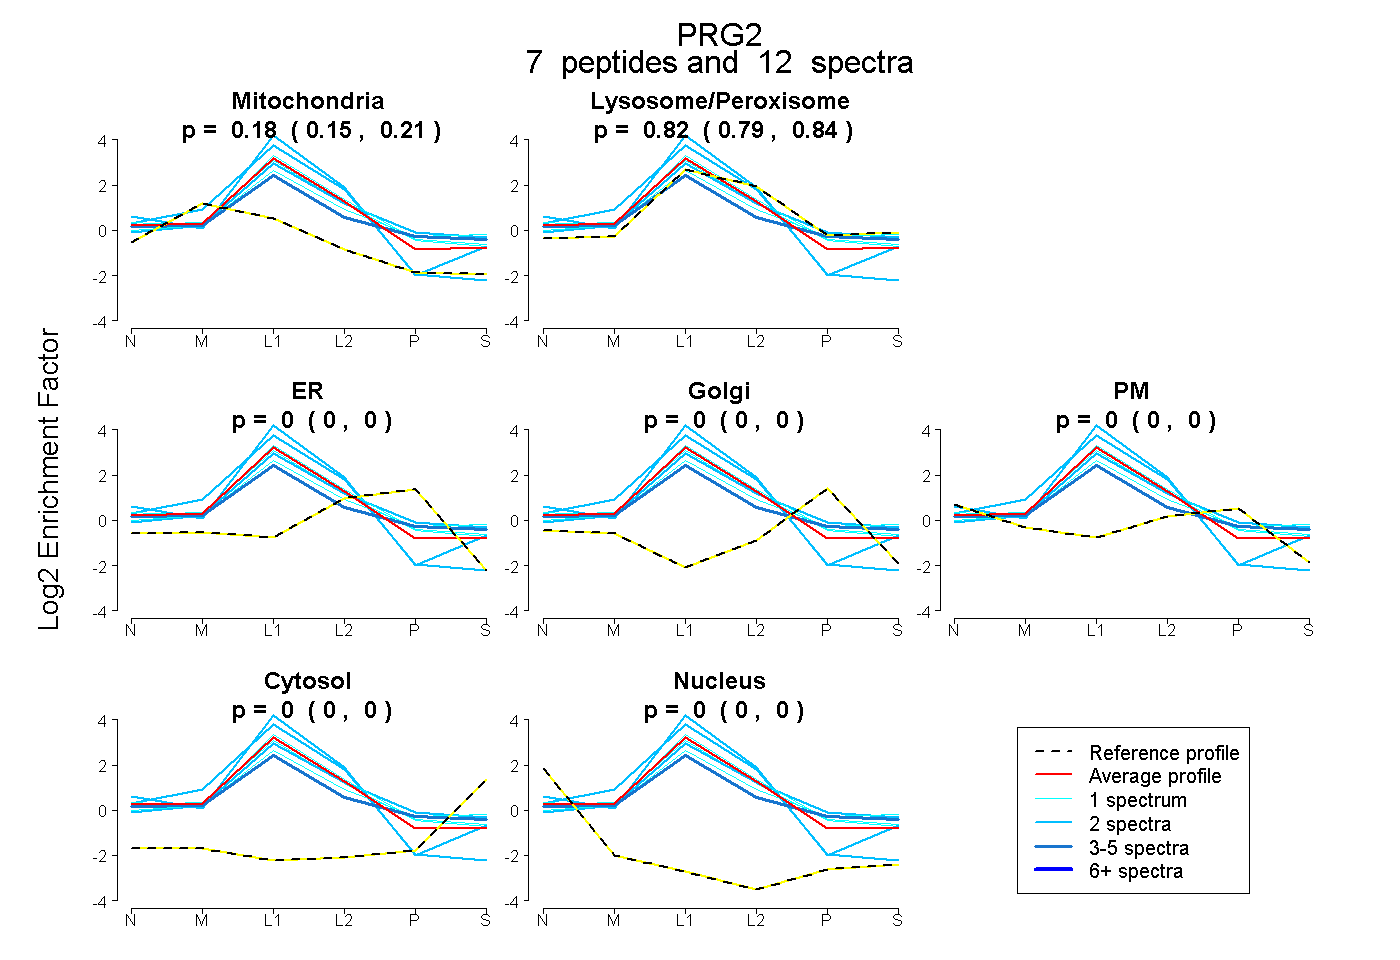 |
0.182
0.153 | 0.207 |
|
0.818
0.789 | 0.843 |
|
0.000
0.000 | 0.000 |
0.000
0.000 | 0.000 |
0.000
0.000 | 0.000 |
0.000
0.000 | 0.000 |
0.000
0.000 | 0.000 |
|
| | | Plot |
|
Lyso |
|
|
|
|
|
|
|
Other |
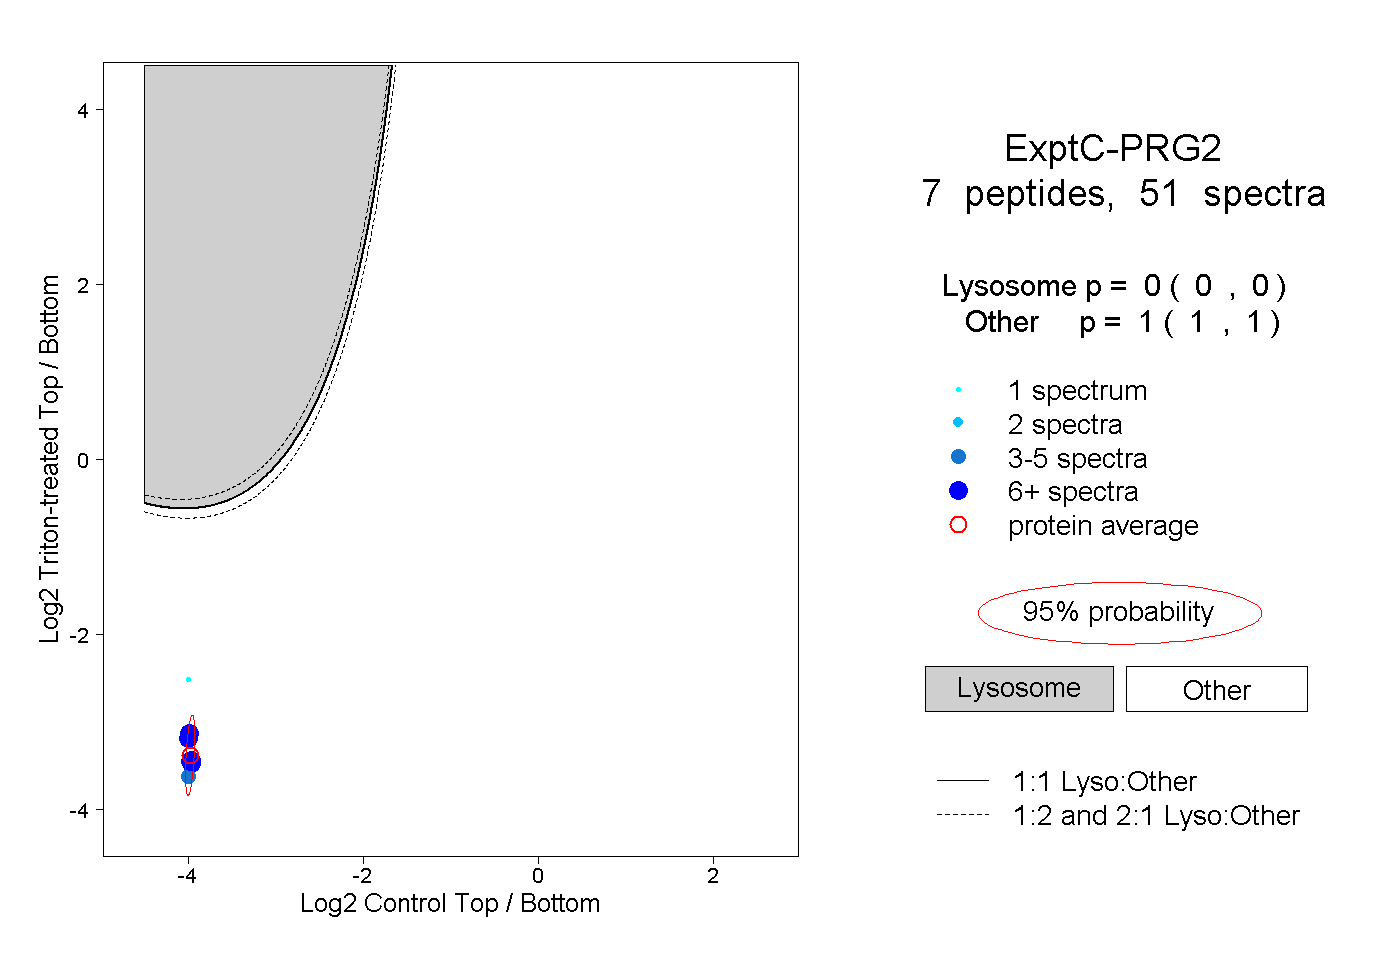
| Expt C |
7
peptides |
51
spectra |
 |
|
0.000
0.000 | 0.000 |
|
|
|
|
|
|
|
1.000
1.000 | 1.000 |
| 6 spectra, GINQGQVWIGGR |
|
0.000 |
|
|
|
|
|
|
|
1.000 |
| 10 spectra, IVGWGR |
|
0.000 |
|
|
|
|
|
|
|
1.000 |
| 8 spectra, CVTLCTR |
|
0.000 |
|
|
|
|
|
|
|
1.000 |
| 5 spectra, IQSFVR |
|
0.000 |
|
|
|
|
|
|
|
1.000 |
| 1 spectrum, SGCGK |
|
0.000 |
|
|
|
|
|
|
|
1.000 |
| 15 spectra, RPECFNK |
|
0.000 |
|
|
|
|
|
|
|
1.000 |
| 6 spectra, AQLVCR |
|
0.000 |
|
|
|
|
|
|
|
1.000 |
| | | Plot |
|
Lyso |
|
|
|
|
|
|
|
Other |
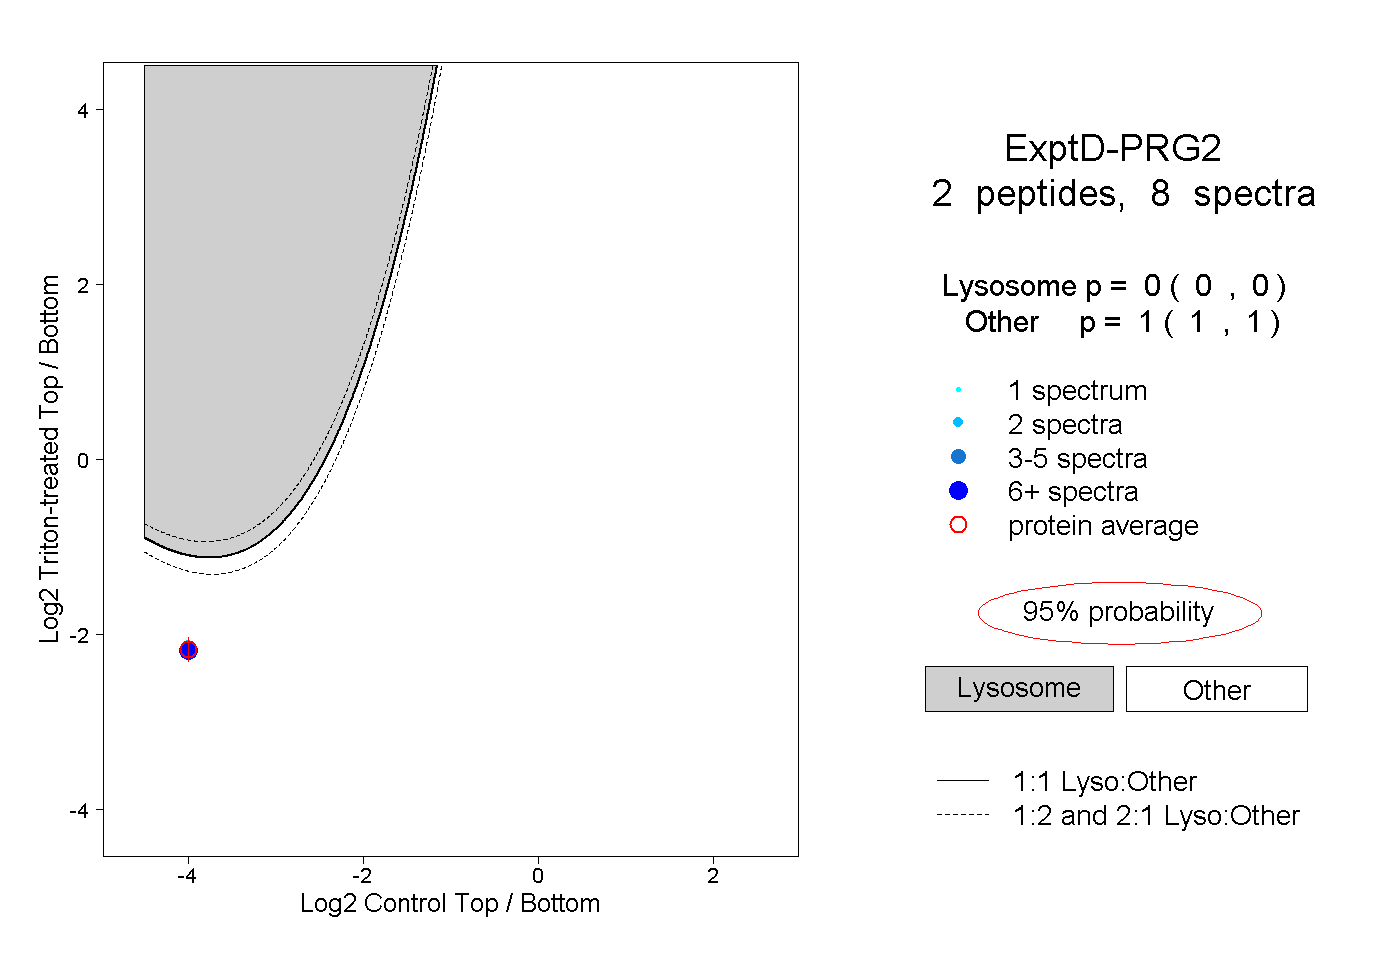
| Expt D |
2
peptides |
8
spectra |
 |
|
0.000
0.000 | 0.000 |
|
|
|
|
|
|
|
1.000
1.000 | 1.000 |