7
7peptides
spectra
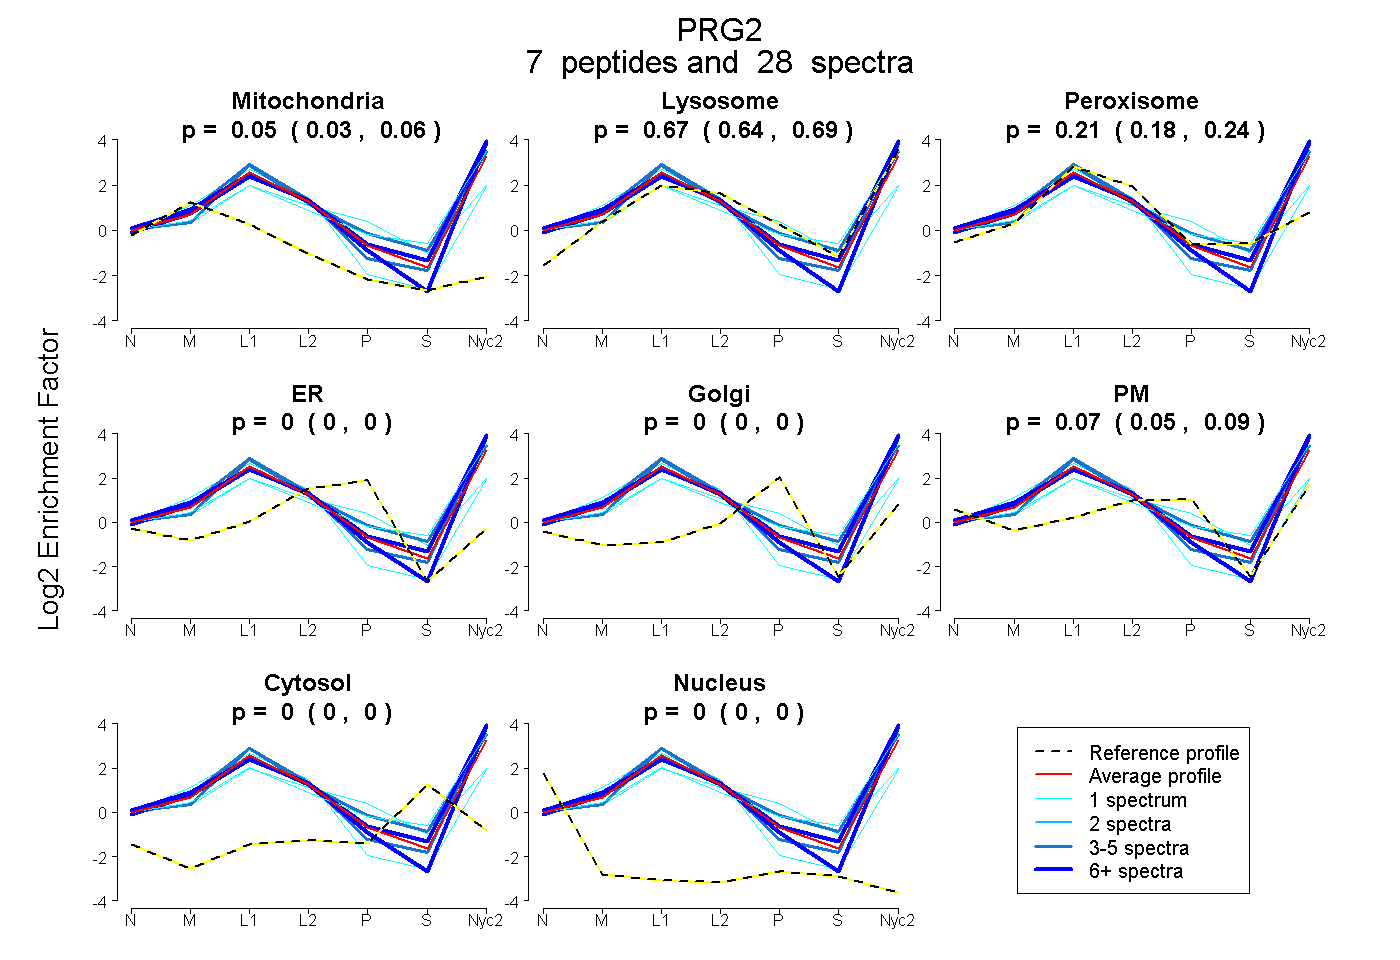
0.031 | 0.059
0.635 | 0.694
0.178 | 0.239
0.000 | 0.000
0.000 | 0.000
0.050 | 0.091
0.000 | 0.000
0.000 | 0.000
7peptides
spectra
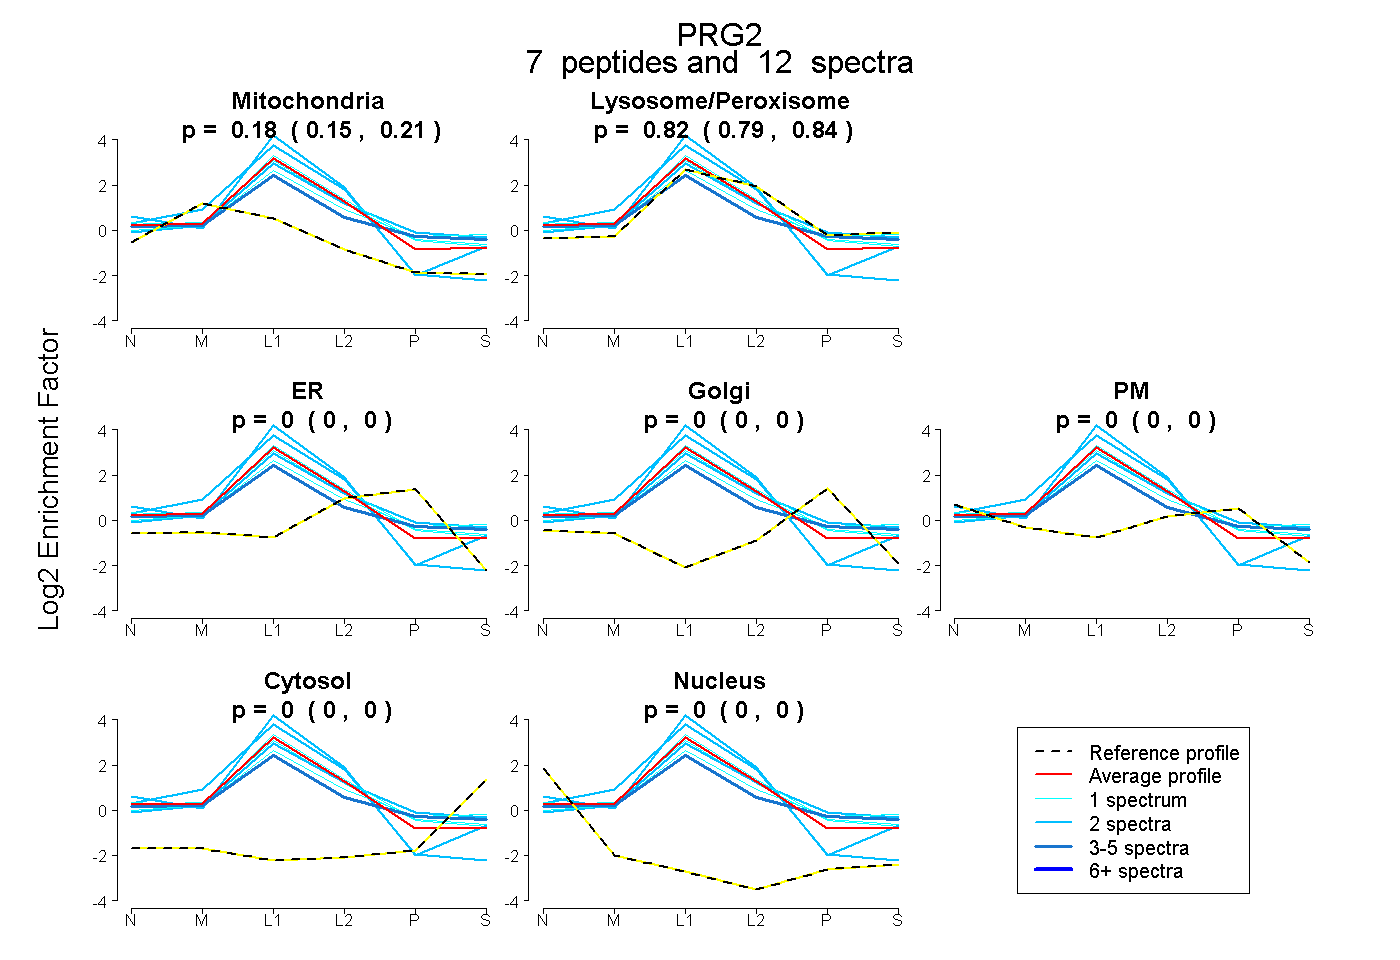
0.153 | 0.207
0.789 | 0.843
0.000 | 0.000
0.000 | 0.000
0.000 | 0.000
0.000 | 0.000
0.000 | 0.000