 5
5peptides
spectra
0.035 | 0.228
0.000 | 0.000
0.017 | 0.226
0.024 | 0.511
0.000 | 0.318
0.000 | 0.250
0.130 | 0.315
0.000 | 0.000
2peptides
spectra
NA | NA
NA | NA
NA | NA
NA | NA
NA | NA
NA | NA
NA | NA
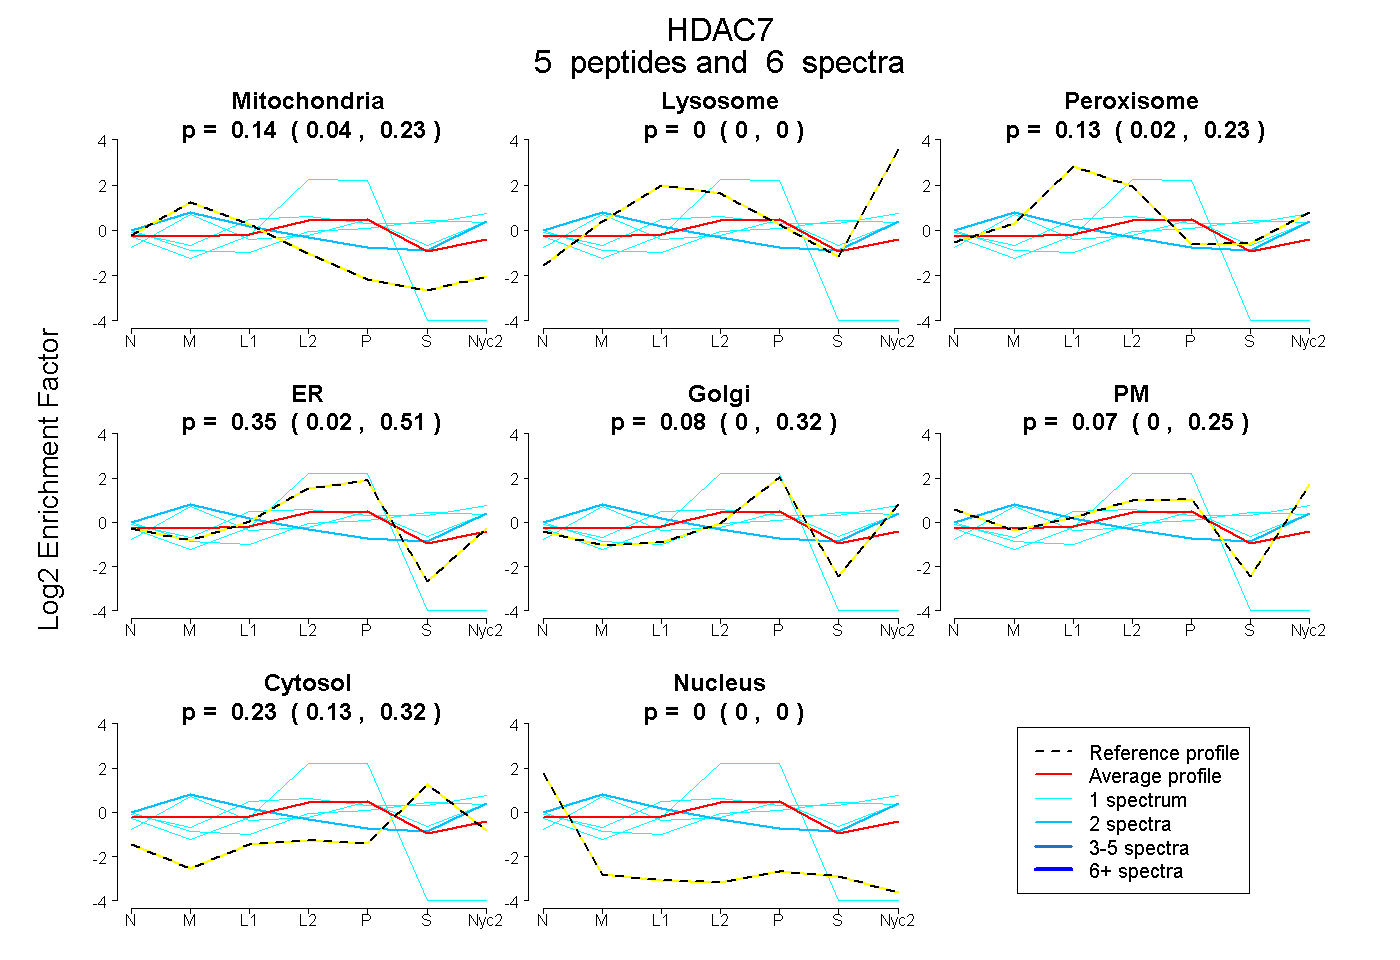
| Plot | Mito | Lyso | Perox | ER | Golgi | PM | Cytosol | Nucleus | |||||
| Expt A |
5 peptides |
6 spectra |
|
0.140 0.035 | 0.228 |
0.000 0.000 | 0.000 |
0.132 0.017 | 0.226 |
0.345 0.024 | 0.511 |
0.076 0.000 | 0.318 |
0.073 0.000 | 0.250 |
0.235 0.130 | 0.315 |
0.000 0.000 | 0.000 |
||
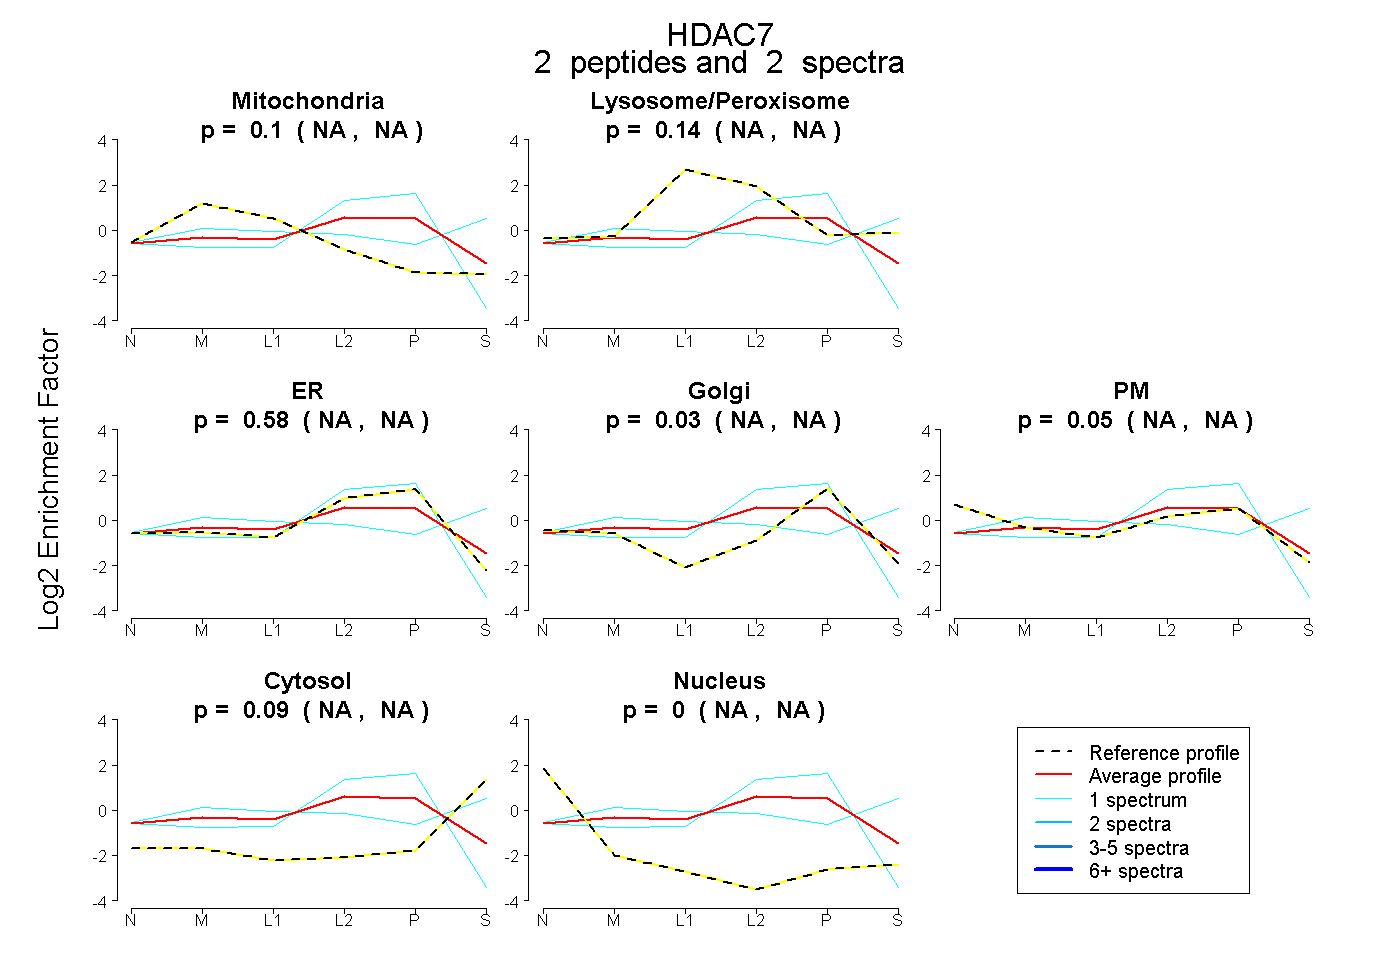
| Plot | Mito | Lyso or Perox | ER | Golgi | PM | Cytosol | Nucleus | ||||||
| Expt B |
2 peptides |
2 spectra |
|
0.098 NA | NA |
0.139 NA | NA |
0.581 NA | NA |
0.034 NA | NA |
0.054 NA | NA |
0.095 NA | NA |
0.000 NA | NA |
| 1 spectrum, THSTLGPR | 0.128 | 0.371 | 0.000 | 0.020 | 0.111 | 0.369 | 0.000 | |||
| 1 spectrum, NPLLR | 0.000 | 0.000 | 1.000 | 0.000 | 0.000 | 0.000 | 0.000 |