11
11peptides
spectra
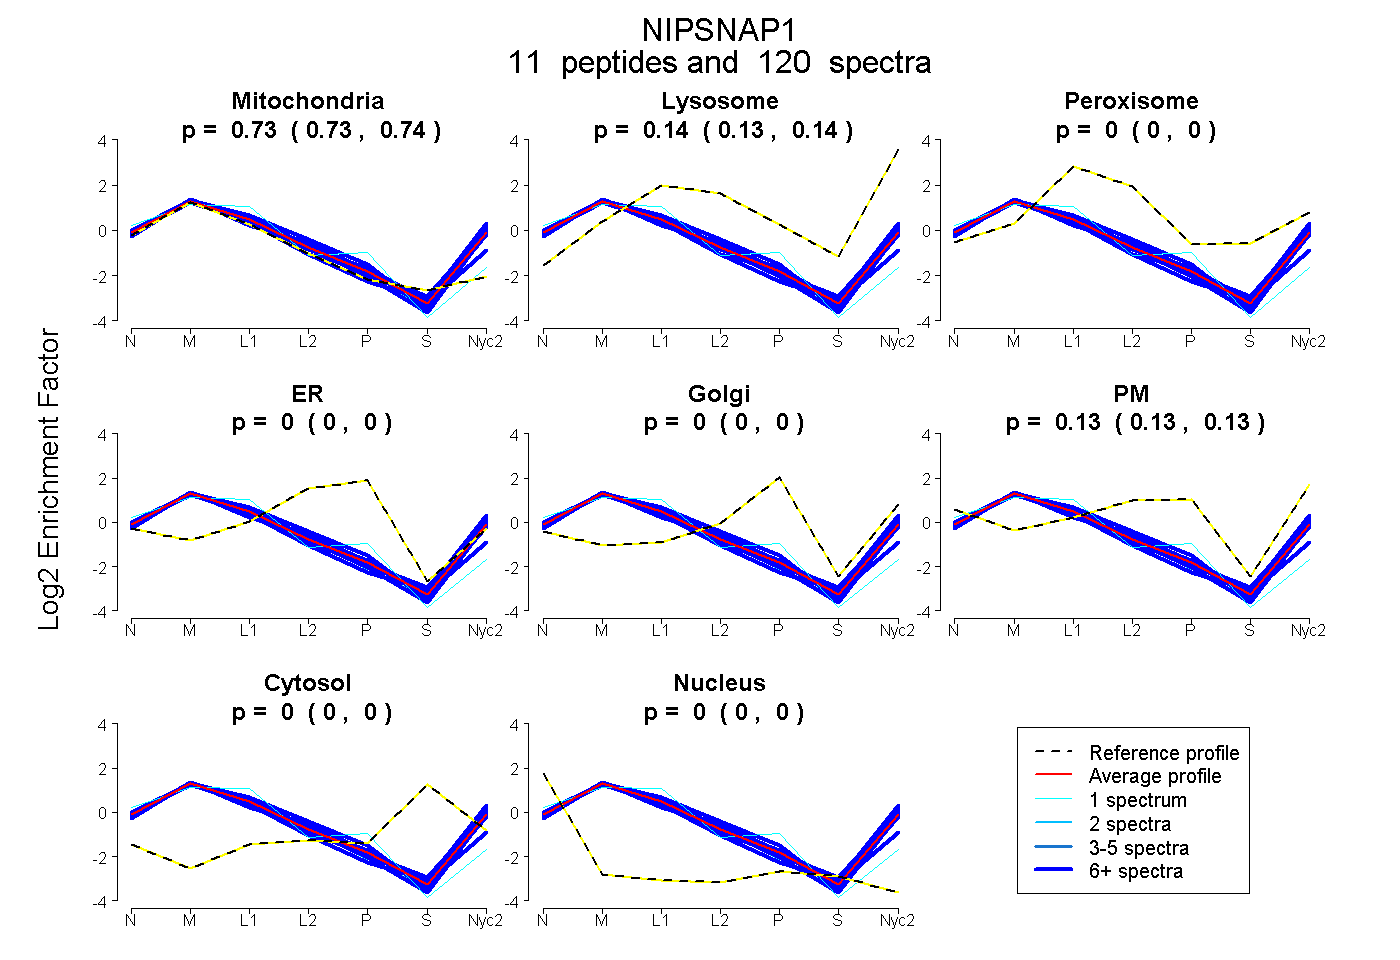
0.730 | 0.736
0.135 | 0.141
0.000 | 0.000
0.000 | 0.000
0.000 | 0.000
0.125 | 0.131
0.000 | 0.000
0.000 | 0.000
9peptides
spectra
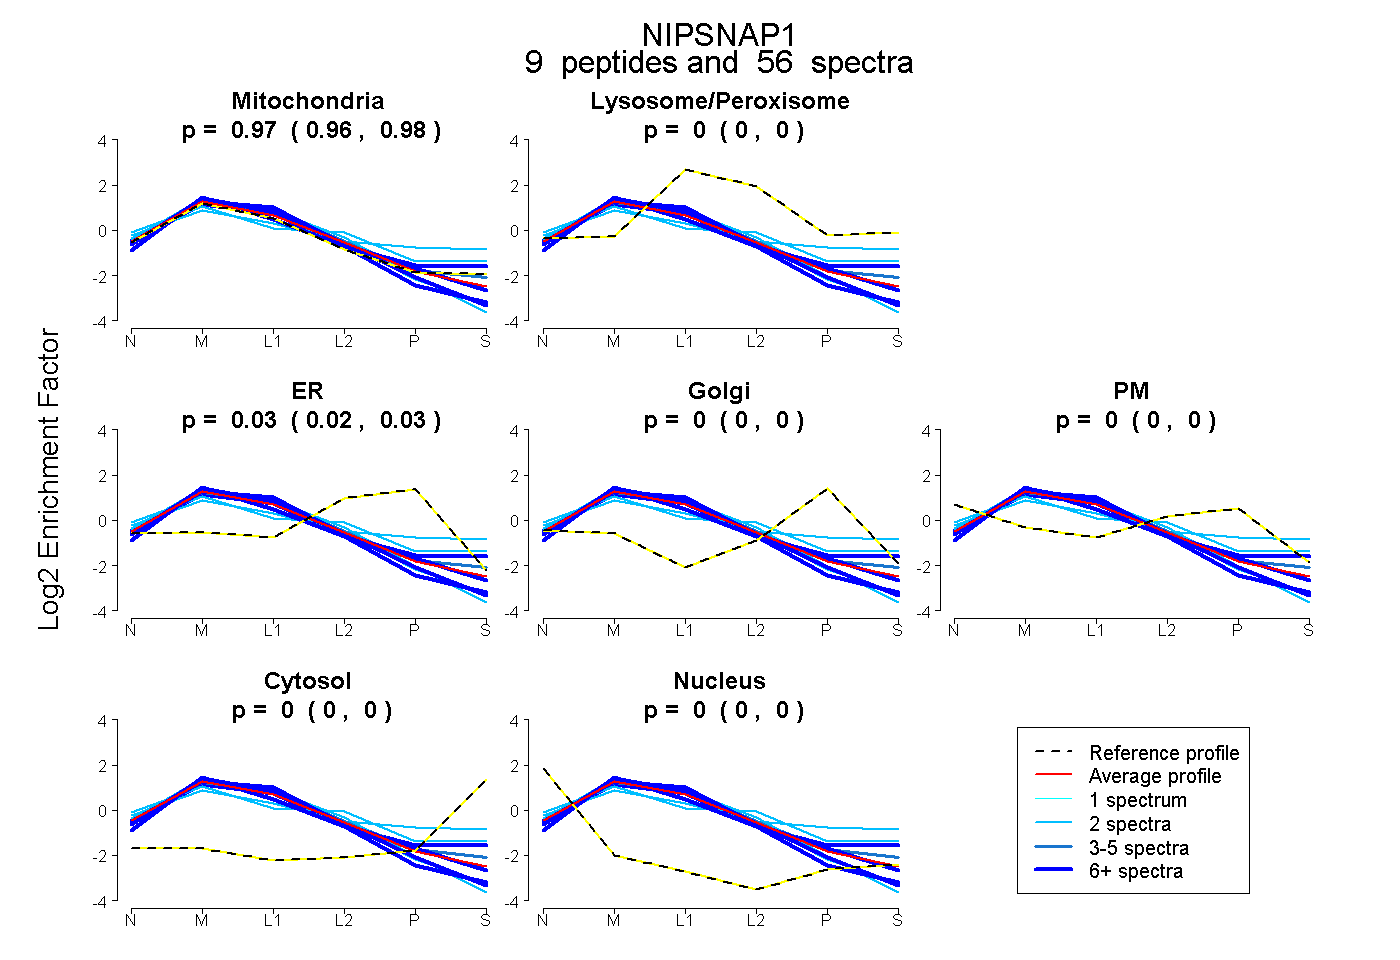
0.964 | 0.978
0.000 | 0.000
0.020 | 0.034
0.000 | 0.000
0.000 | 0.000
0.000 | 0.000
0.000 | 0.000