 11
11peptides
spectra
0.730 | 0.736
0.135 | 0.141
0.000 | 0.000
0.000 | 0.000
0.000 | 0.000
0.125 | 0.131
0.000 | 0.000
0.000 | 0.000
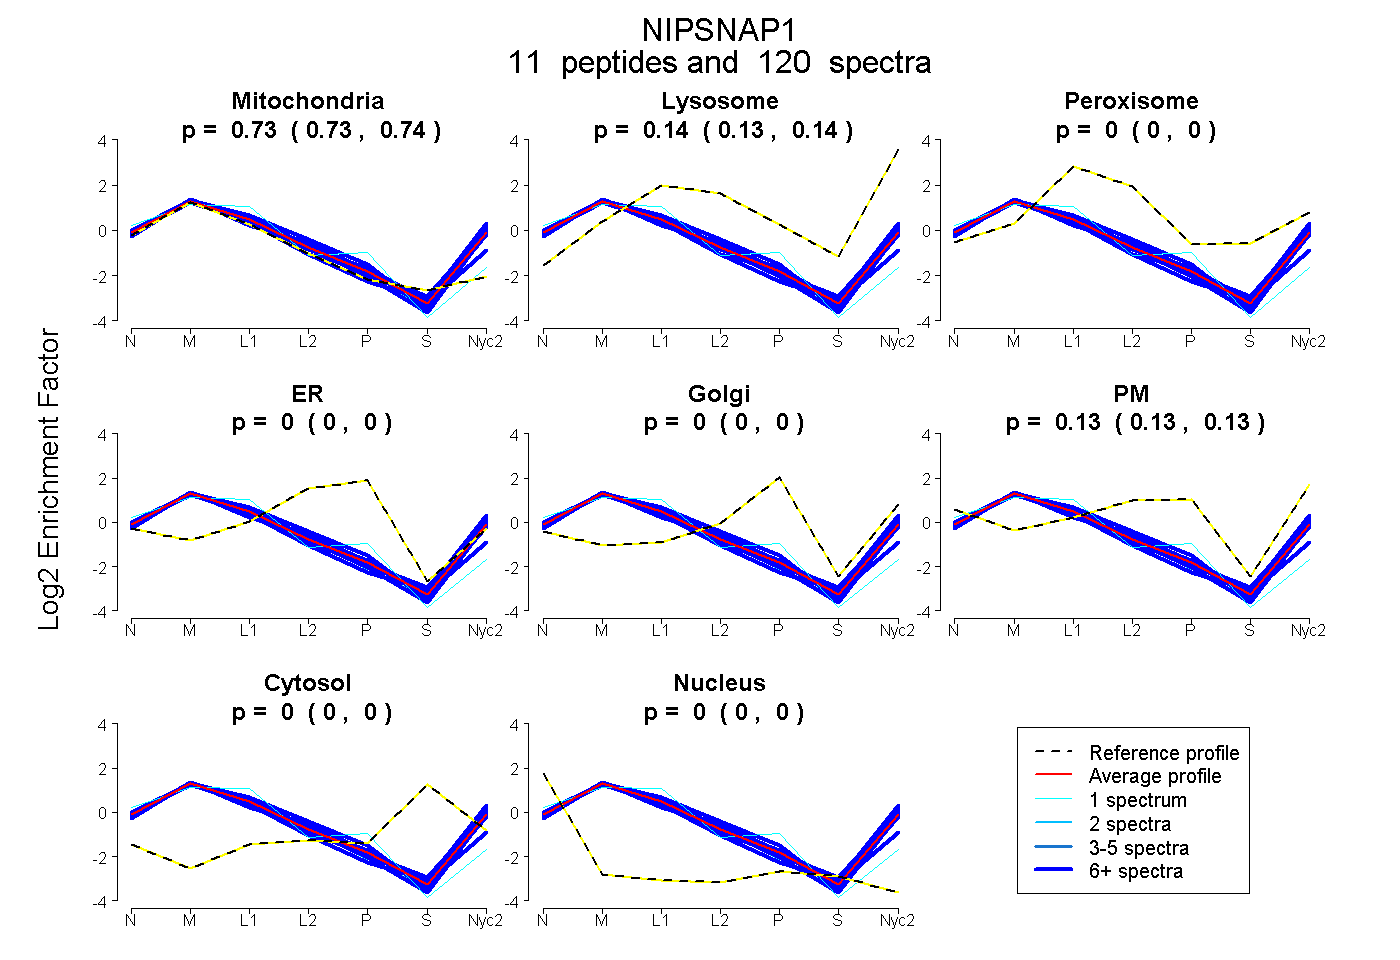
| Plot | Mito | Lyso | Perox | ER | Golgi | PM | Cytosol | Nucleus | |||||
| Expt A |
11 peptides |
120 spectra |
|
0.733 0.730 | 0.736 |
0.138 0.135 | 0.141 |
0.000 0.000 | 0.000 |
0.000 0.000 | 0.000 |
0.000 0.000 | 0.000 |
0.129 0.125 | 0.131 |
0.000 0.000 | 0.000 |
0.000 0.000 | 0.000 |
| 26 spectra, MLLSR | 0.758 | 0.140 | 0.000 | 0.000 | 0.000 | 0.102 | 0.000 | 0.000 | ||
| 8 spectra, GWDENVYYTVPLVR | 0.760 | 0.134 | 0.000 | 0.000 | 0.000 | 0.106 | 0.000 | 0.000 | ||
| 8 spectra, LKPGTMIEWGNNWAR | 0.632 | 0.164 | 0.000 | 0.000 | 0.000 | 0.204 | 0.000 | 0.000 | ||
| 1 spectrum, SLFVHK | 0.816 | 0.000 | 0.000 | 0.110 | 0.000 | 0.073 | 0.000 | 0.000 | ||
| 15 spectra, DSEGSWFR | 0.822 | 0.013 | 0.000 | 0.000 | 0.000 | 0.165 | 0.000 | 0.000 | ||
| 12 spectra, NAAWR | 0.694 | 0.151 | 0.000 | 0.000 | 0.000 | 0.155 | 0.000 | 0.000 | ||
| 7 spectra, EYLEFR | 0.731 | 0.243 | 0.000 | 0.000 | 0.000 | 0.000 | 0.000 | 0.026 | ||
| 7 spectra, IMIPLK | 0.732 | 0.197 | 0.000 | 0.000 | 0.000 | 0.071 | 0.000 | 0.000 | ||
| 26 spectra, AGPNIYELR | 0.693 | 0.163 | 0.000 | 0.000 | 0.000 | 0.144 | 0.000 | 0.000 | ||
| 1 spectrum, ETSNLYK | 0.745 | 0.133 | 0.000 | 0.000 | 0.000 | 0.122 | 0.000 | 0.000 | ||
| 9 spectra, FSGGYPALMDCMNK | 0.715 | 0.188 | 0.000 | 0.000 | 0.000 | 0.096 | 0.000 | 0.000 |
| Plot | Mito | Lyso or Perox | ER | Golgi | PM | Cytosol | Nucleus | ||||||
| Expt B |
9 peptides |
56 spectra |
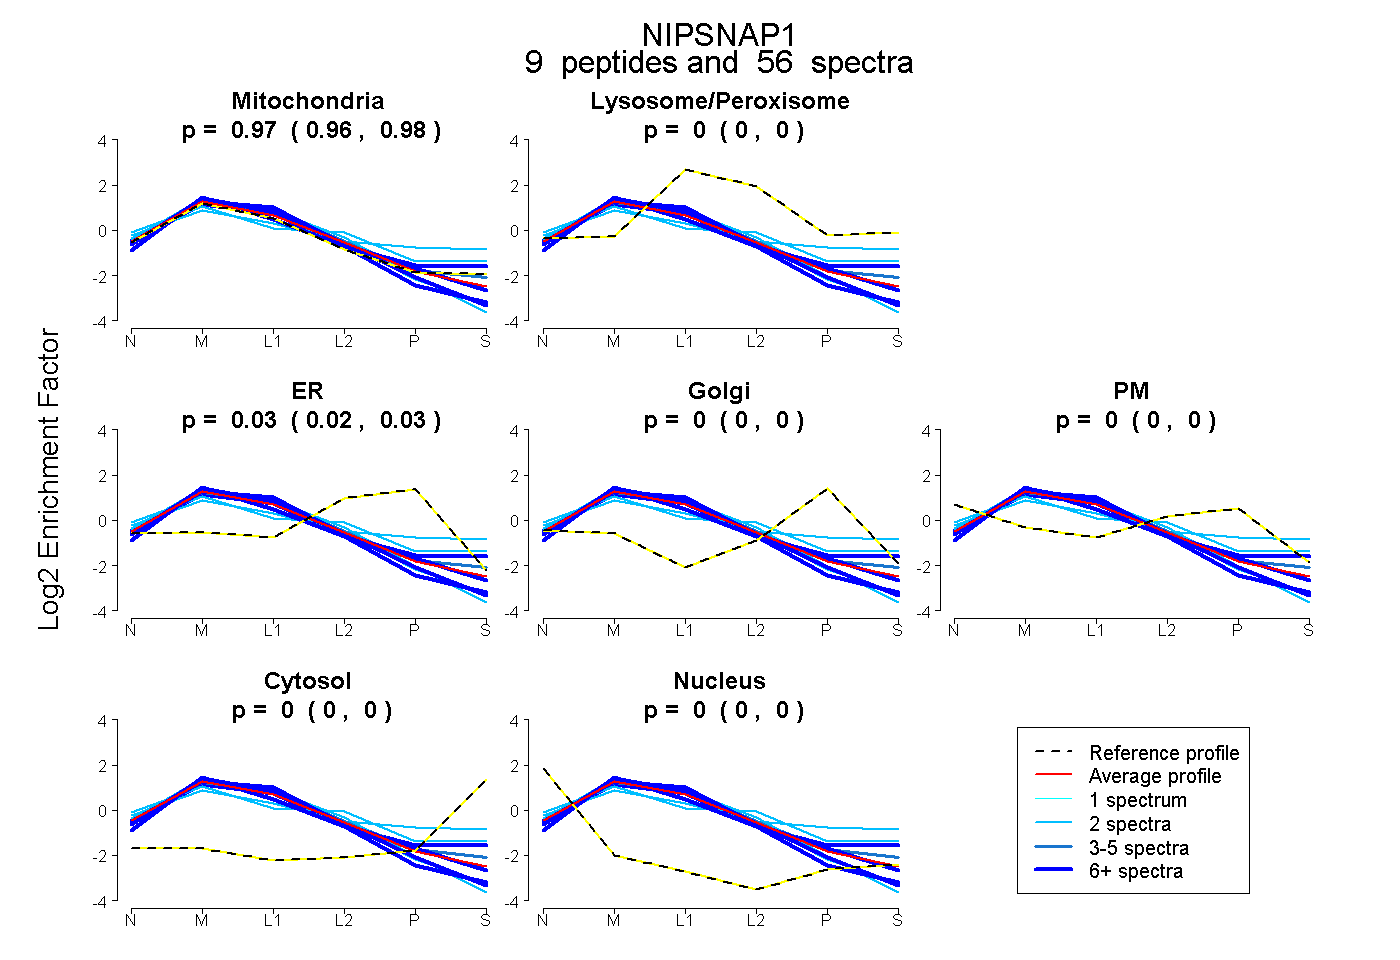 |
0.972 0.964 | 0.978 |
0.000 0.000 | 0.000 |
0.028 0.020 | 0.034 |
0.000 0.000 | 0.000 |
0.000 0.000 | 0.000 |
0.000 0.000 | 0.000 |
0.000 0.000 | 0.000 |
|||
| Plot | Lyso | Other | |||||||||||
| Expt C |
12 peptides |
342 spectra |
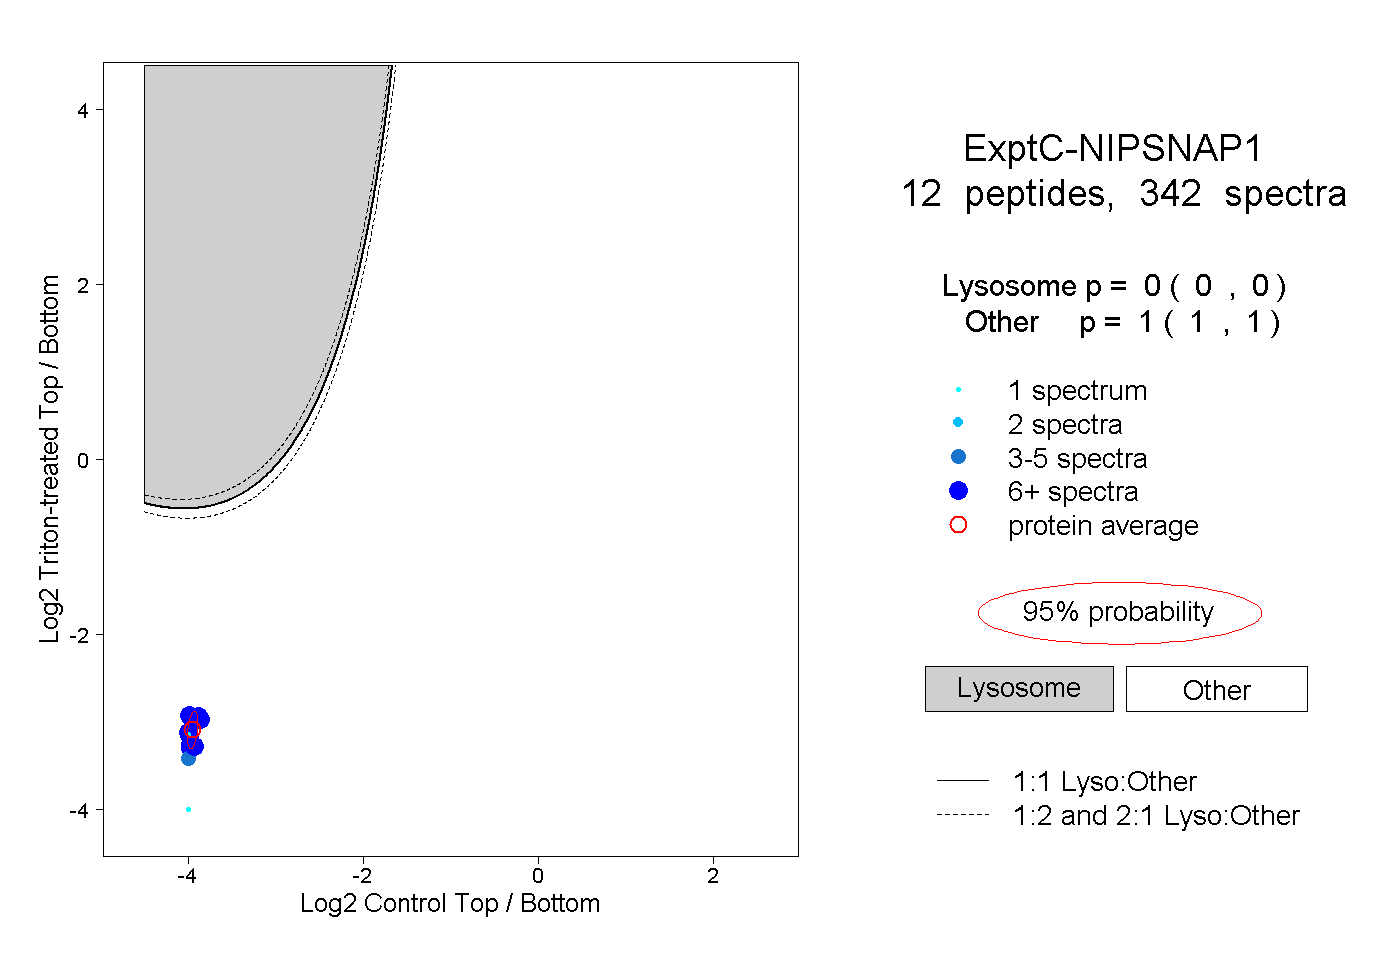 |
0.000 0.000 | 0.000 |
1.000 1.000 | 1.000 |
||||||||
| Plot | Lyso | Other | |||||||||||
| Expt D |
5 peptides |
12 spectra |
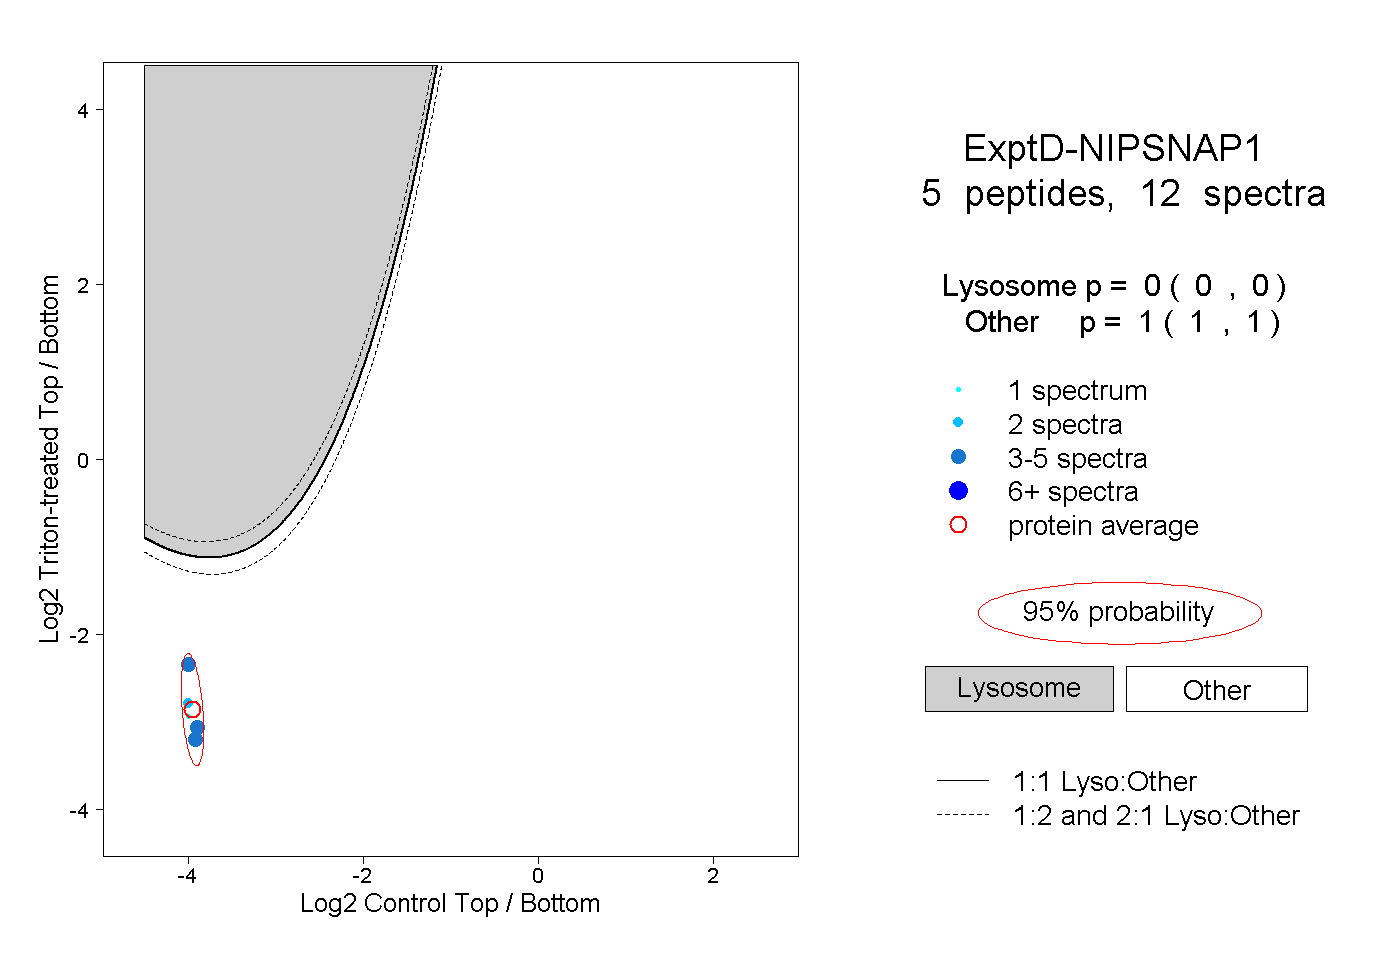 |
0.000 0.000 | 0.000 |
1.000 1.000 | 1.000 |