 23
23peptides
spectra
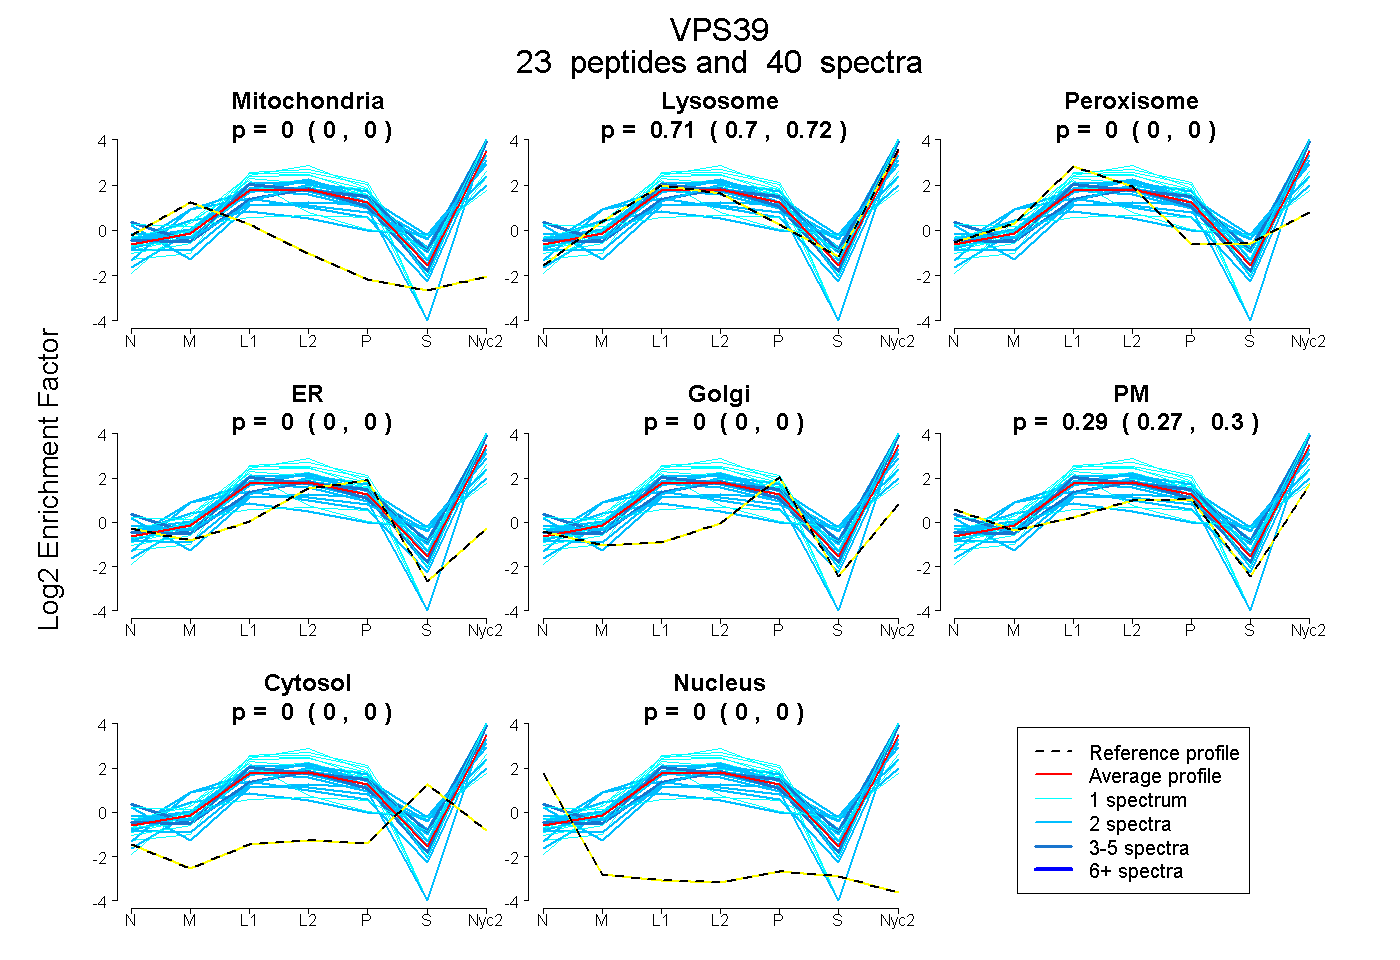
0.000 | 0.000
0.701 | 0.724
0.000 | 0.000
0.000 | 0.000
0.000 | 0.000
0.274 | 0.296
0.000 | 0.000
0.000 | 0.000
6peptides
spectra
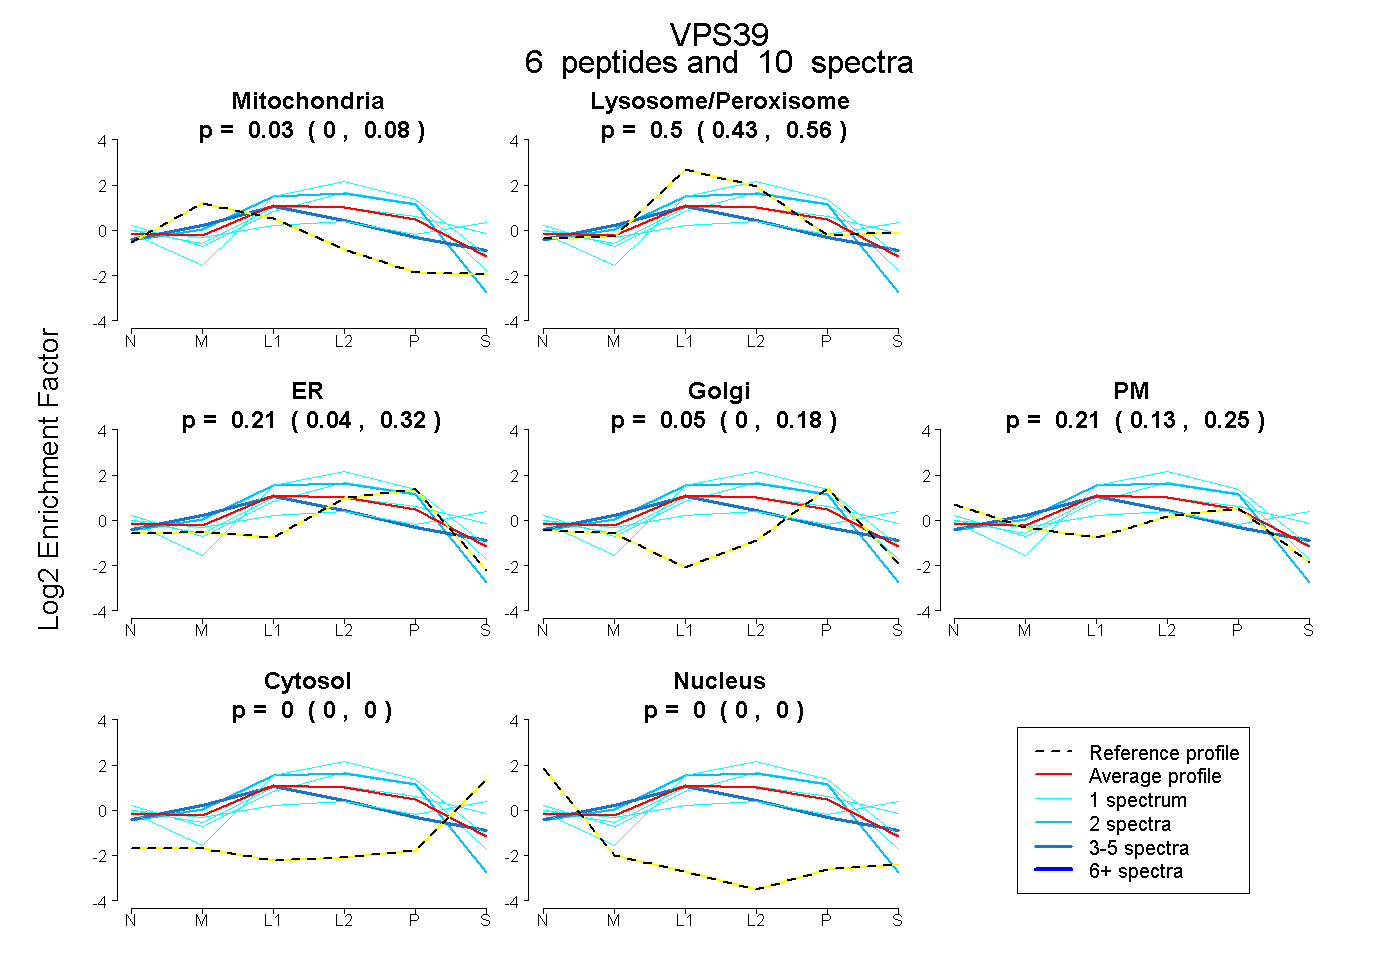
0.000 | 0.085
0.431 | 0.564
0.040 | 0.324
0.000 | 0.182
0.132 | 0.248
0.000 | 0.000
0.000 | 0.000
29peptides
spectra
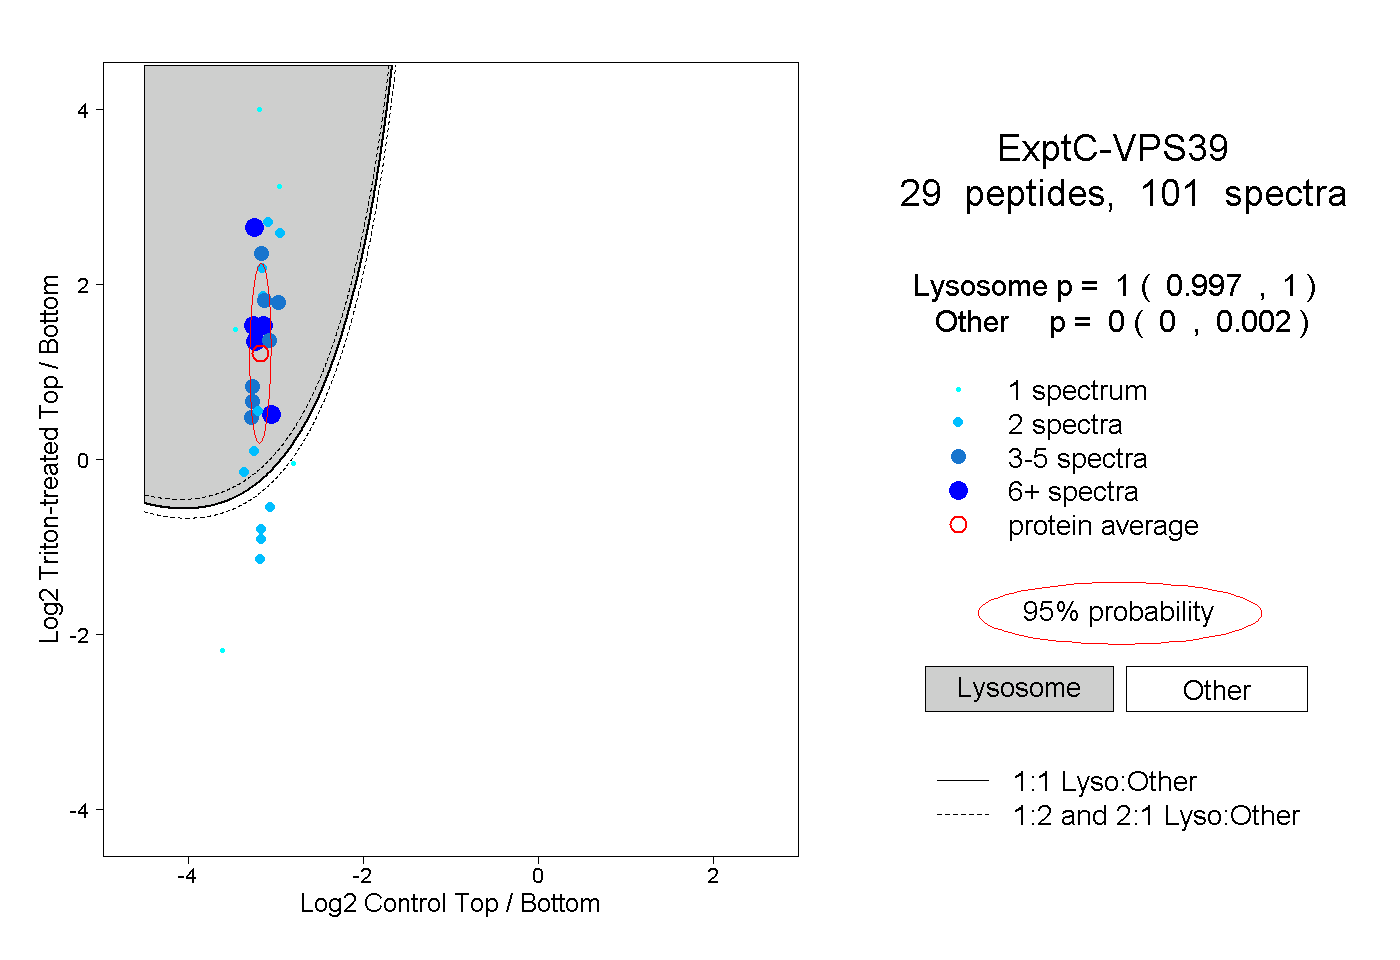
0.997 | 1.000
0.000 | 0.002
9peptides
spectra
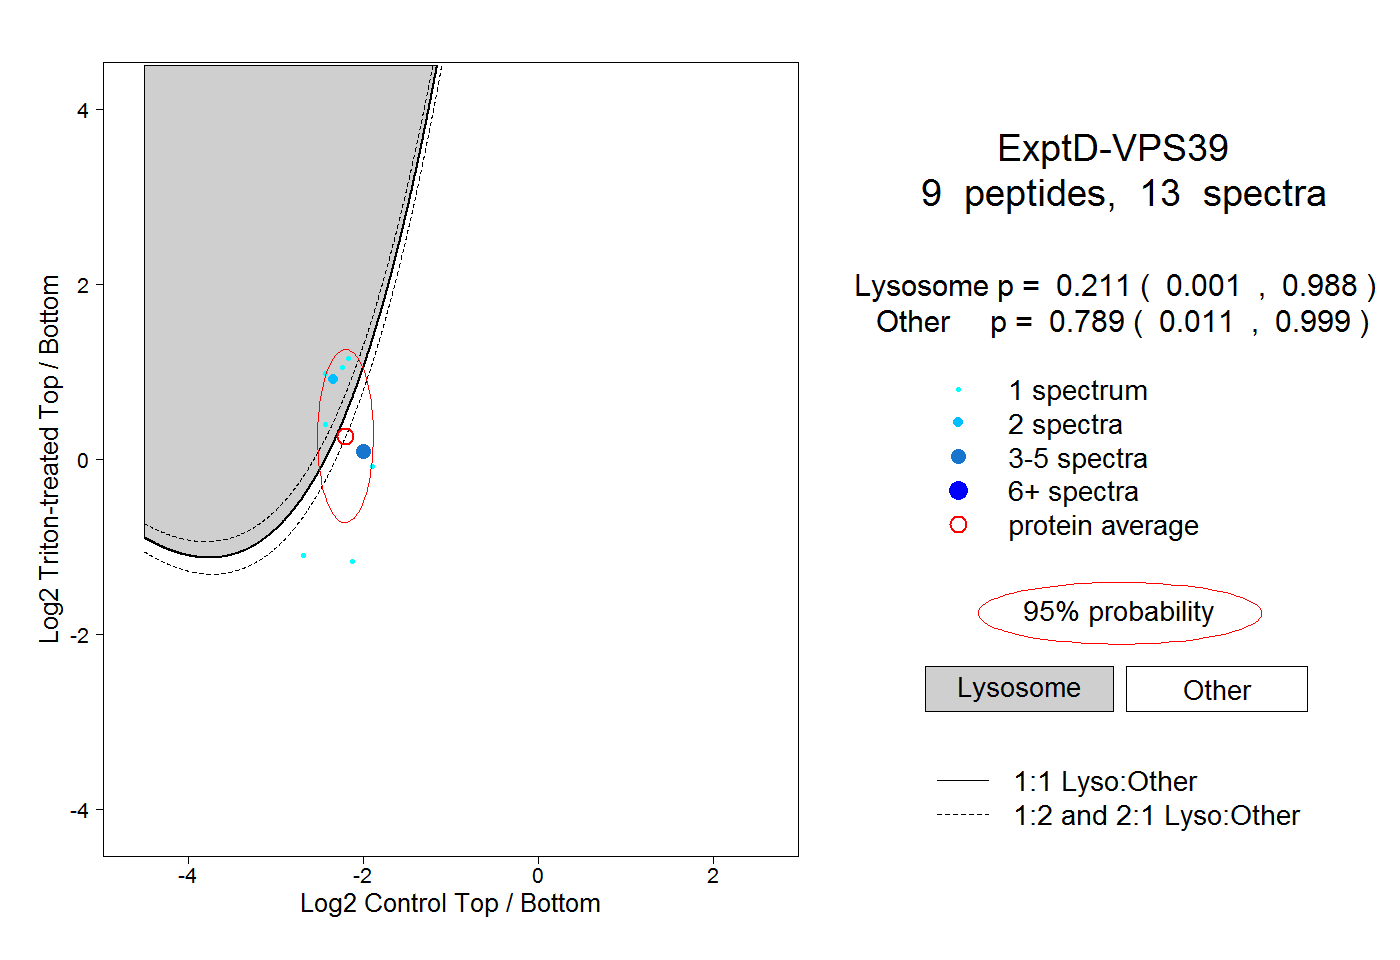
0.001 | 0.988
0.011 | 0.999