 6
6peptides
spectra
0.000 | 0.000
0.000 | 0.000
0.000 | 0.000
0.488 | 0.526
0.000 | 0.000
0.000 | 0.000
0.095 | 0.147
0.337 | 0.393
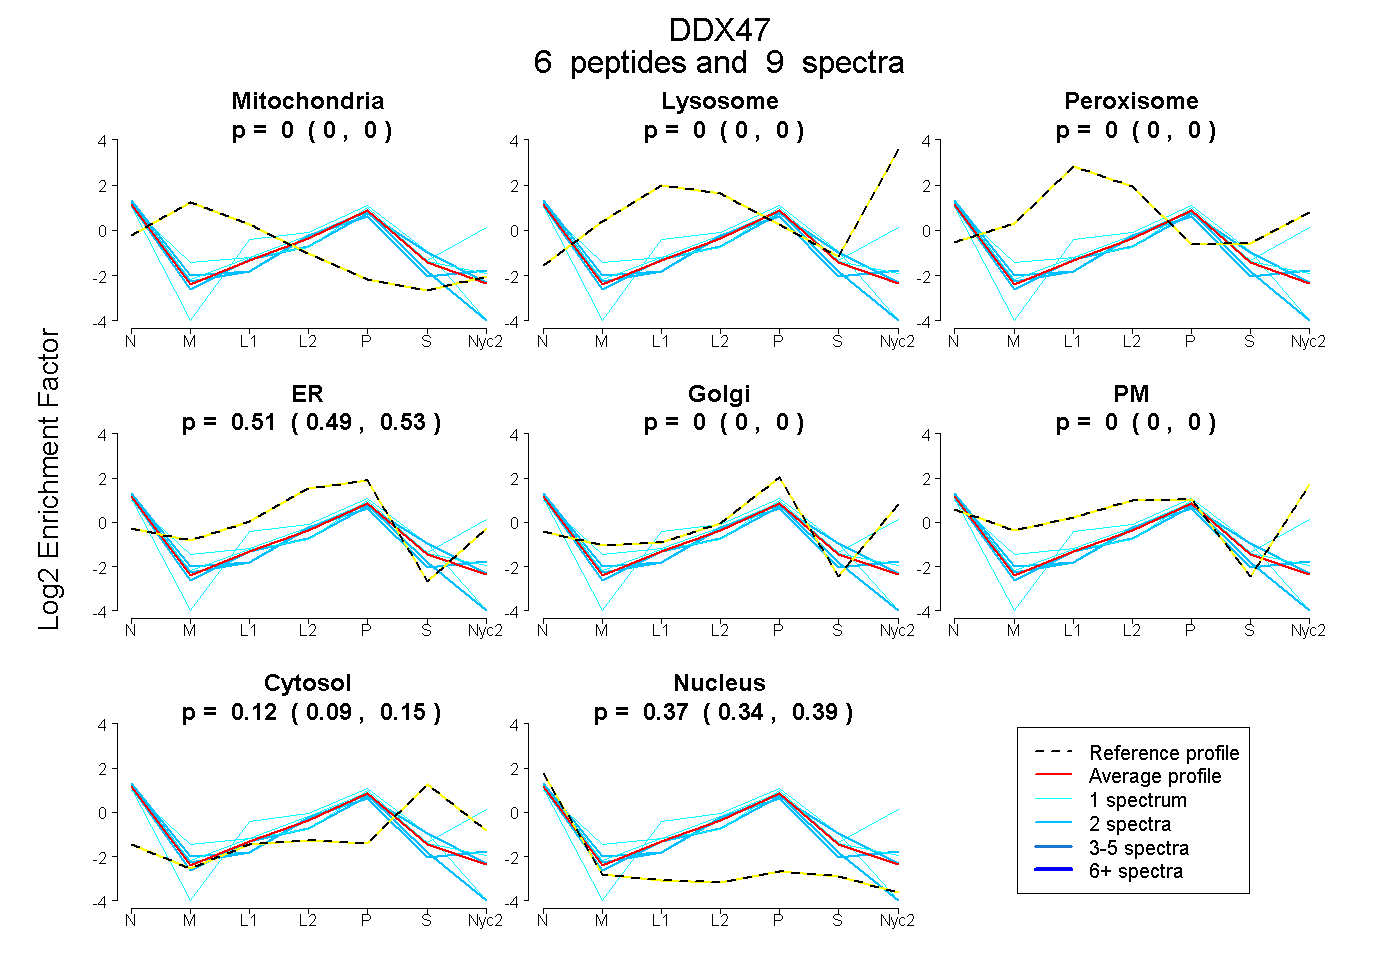
| Plot | Mito | Lyso | Perox | ER | Golgi | PM | Cytosol | Nucleus | |||||
| Expt A |
6 peptides |
9 spectra |
|
0.000 0.000 | 0.000 |
0.000 0.000 | 0.000 |
0.000 0.000 | 0.000 |
0.509 0.488 | 0.526 |
0.000 0.000 | 0.000 |
0.000 0.000 | 0.000 |
0.123 0.095 | 0.147 |
0.368 0.337 | 0.393 |
| 1 spectrum, YLVMDEADR | 0.000 | 0.000 | 0.000 | 0.446 | 0.077 | 0.000 | 0.142 | 0.336 | ||
| 1 spectrum, DIIGLAETGSGK | 0.000 | 0.000 | 0.000 | 0.439 | 0.000 | 0.000 | 0.174 | 0.386 | ||
| 2 spectra, TALLLR | 0.000 | 0.000 | 0.000 | 0.507 | 0.067 | 0.000 | 0.017 | 0.408 | ||
| 1 spectrum, KPHIVIATPGR | 0.000 | 0.000 | 0.000 | 0.000 | 0.304 | 0.385 | 0.152 | 0.159 | ||
| 2 spectra, SILLATDVASR | 0.000 | 0.000 | 0.000 | 0.477 | 0.000 | 0.000 | 0.000 | 0.523 | ||
| 2 spectra, LIDHLENTK | 0.000 | 0.000 | 0.000 | 0.423 | 0.000 | 0.000 | 0.227 | 0.349 |
| Plot | Mito | Lyso or Perox | ER | Golgi | PM | Cytosol | Nucleus | ||||||
| Expt B |
1 peptide |
1 spectrum |
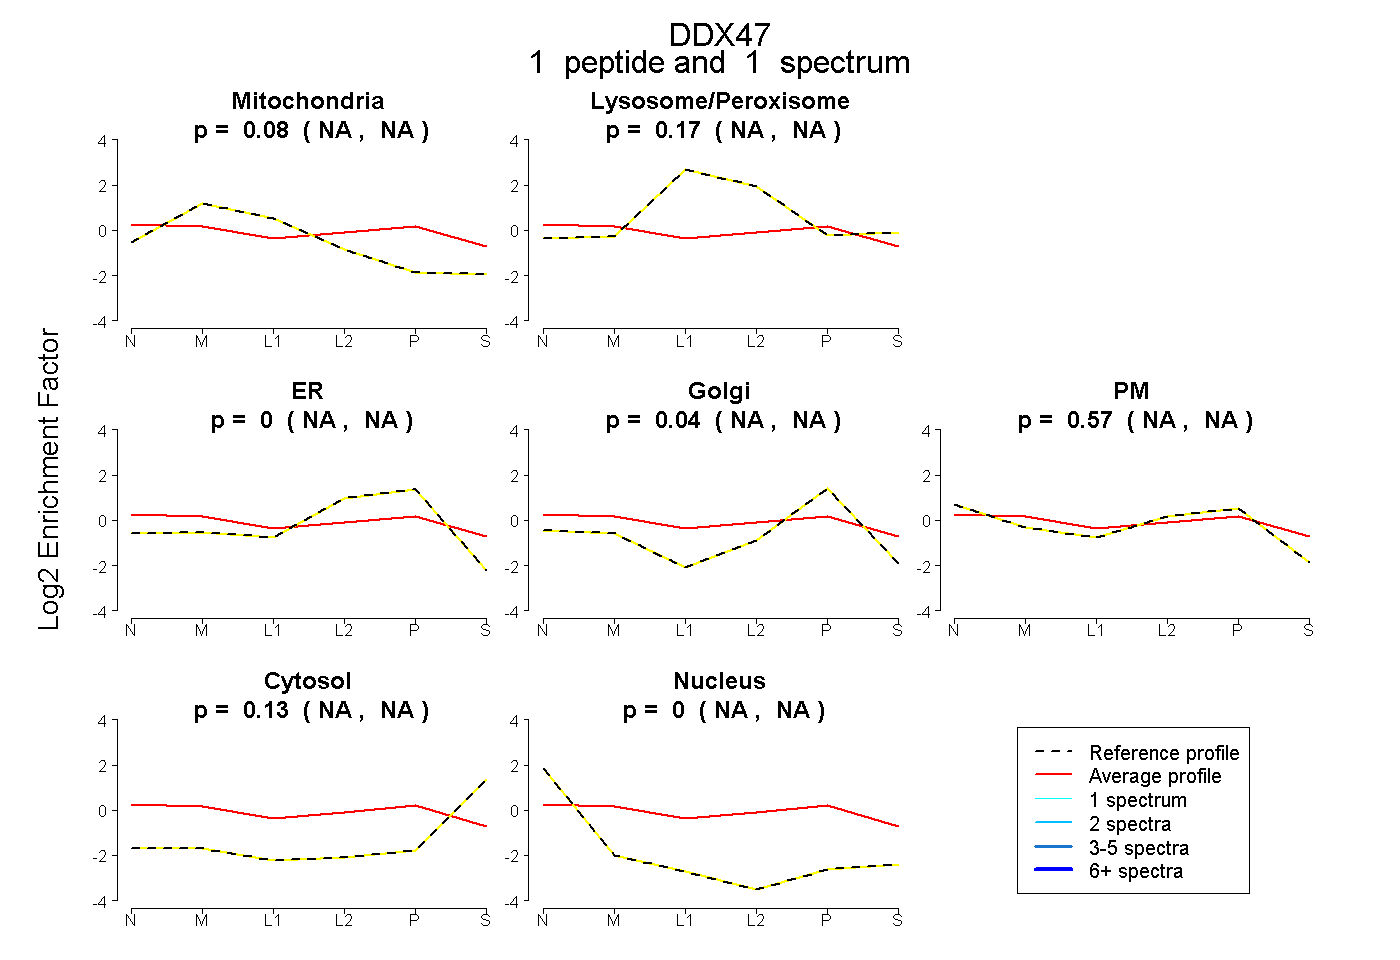 |
0.084 NA | NA |
0.172 NA | NA |
0.000 NA | NA |
0.042 NA | NA |
0.570 NA | NA |
0.132 NA | NA |
0.000 NA | NA |