 5
5peptides
spectra
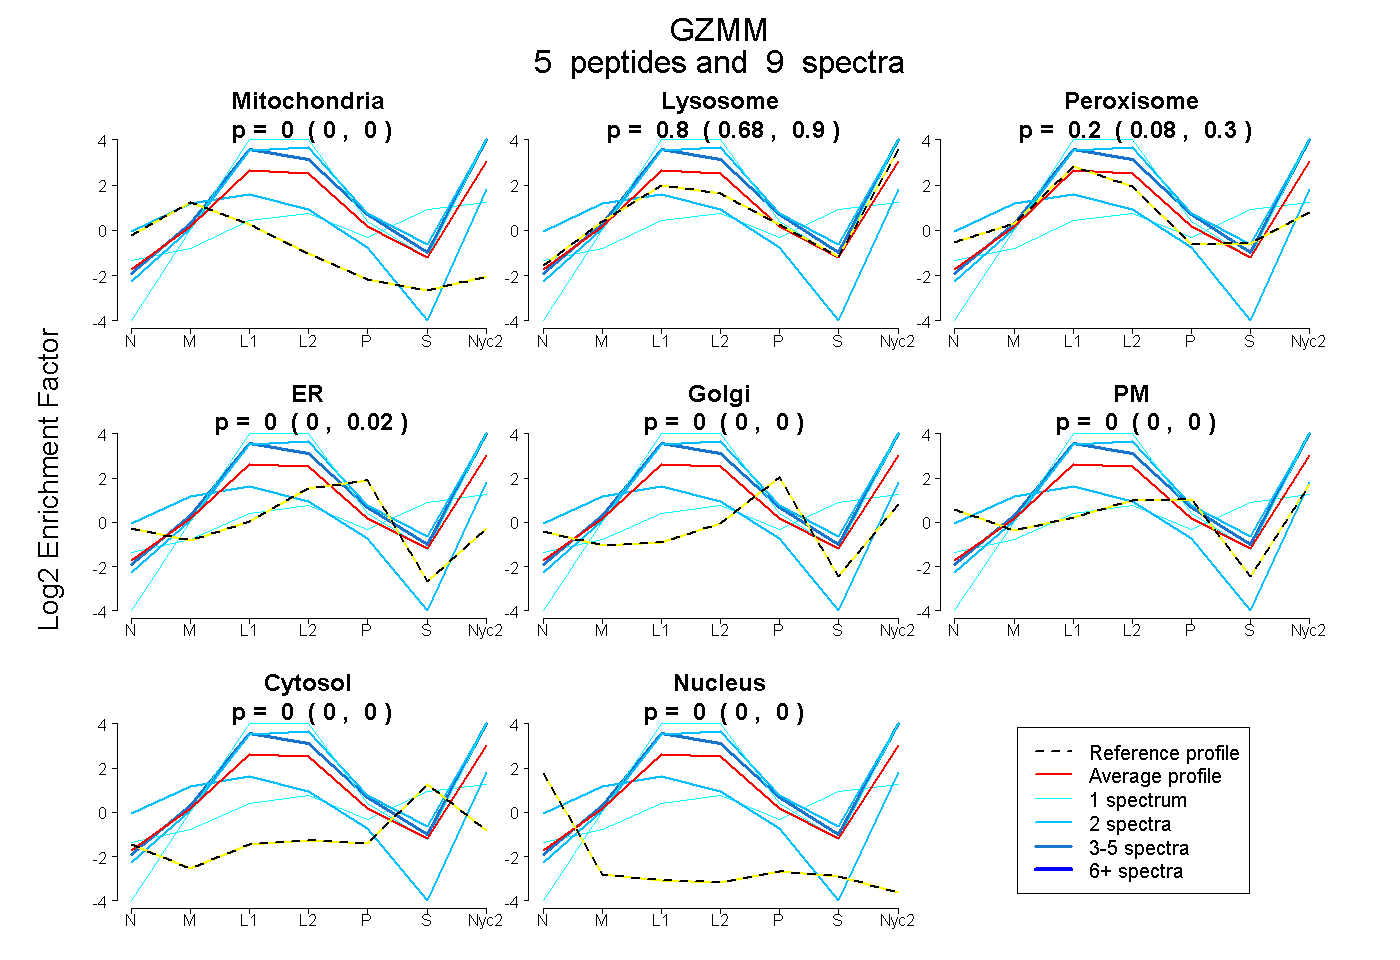
0.000 | 0.000
0.675 | 0.896
0.077 | 0.295
0.000 | 0.023
0.000 | 0.000
0.000 | 0.000
0.000 | 0.000
0.000 | 0.000
5peptides
spectra
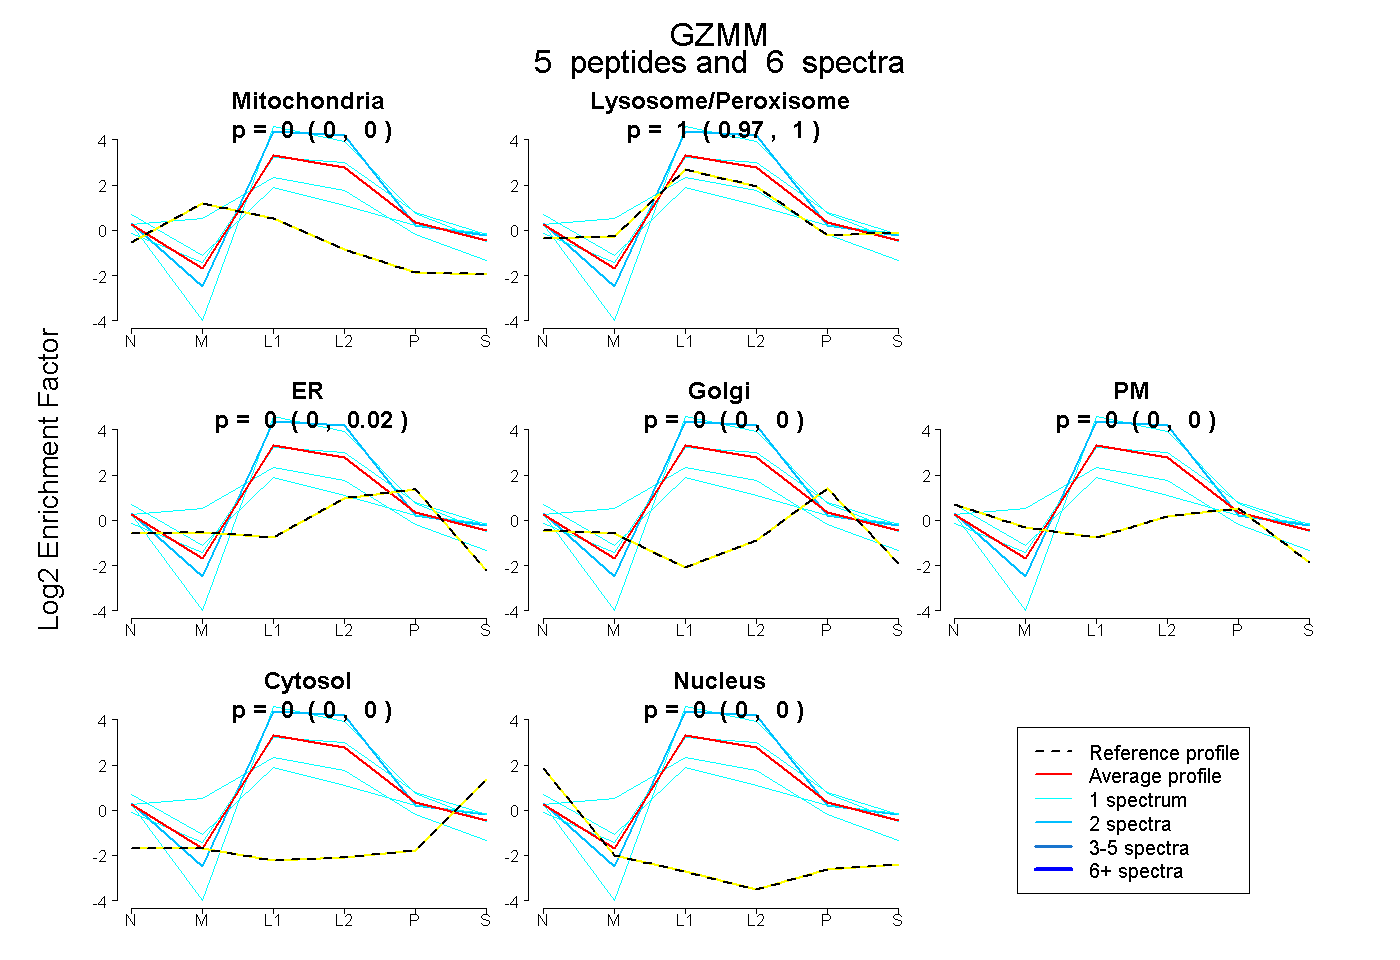
0.000 | 0.000
0.970 | 1.000
0.000 | 0.019
0.000 | 0.000
0.000 | 0.000
0.000 | 0.000
0.000 | 0.000
10peptides
spectra
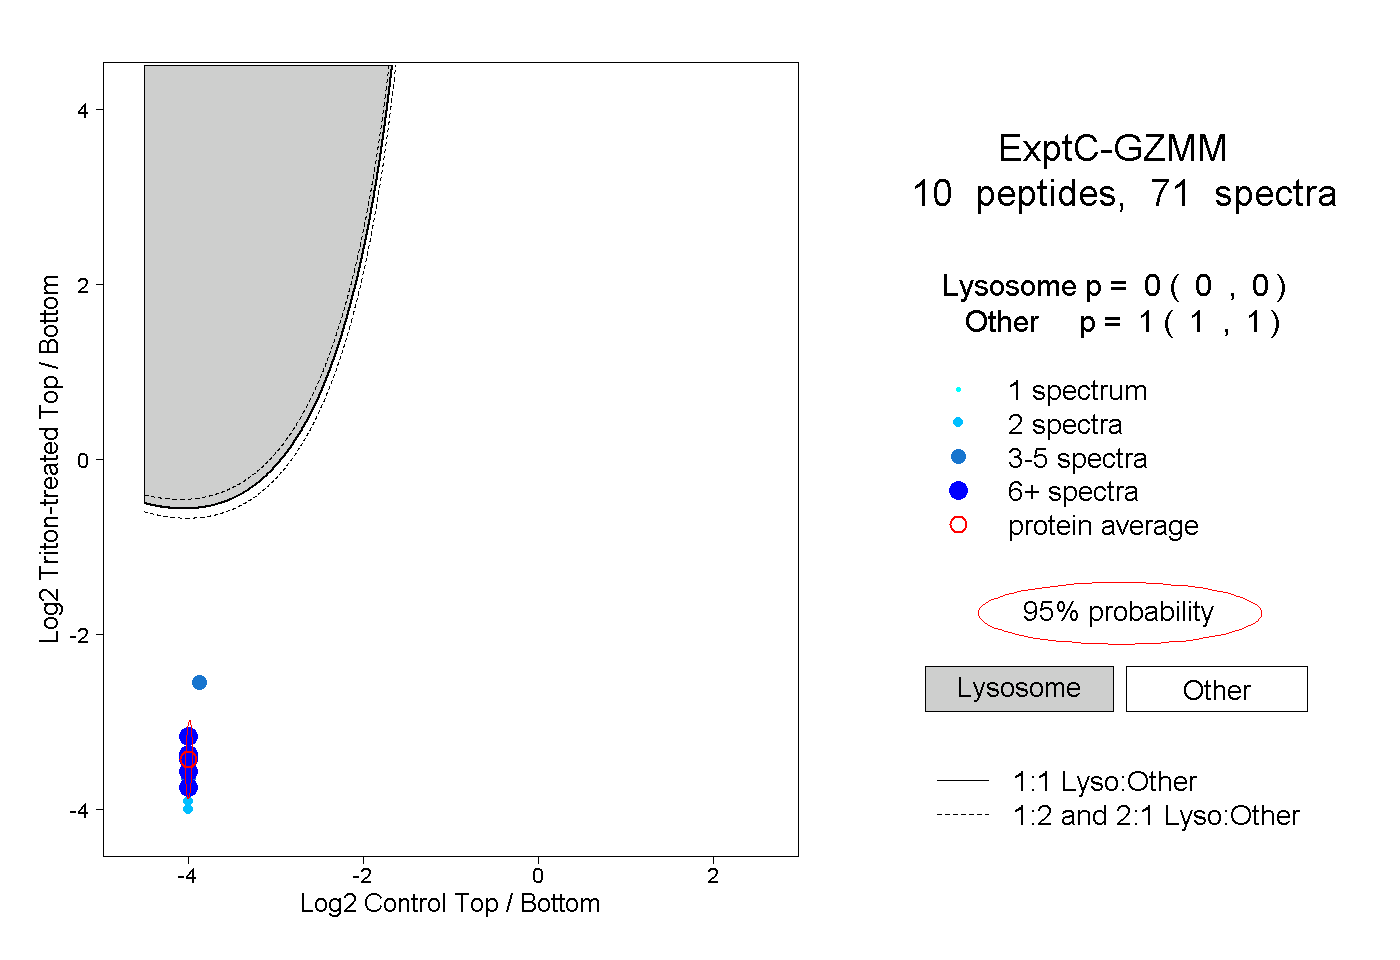
0.000 | 0.000
1.000 | 1.000
2peptides
spectra
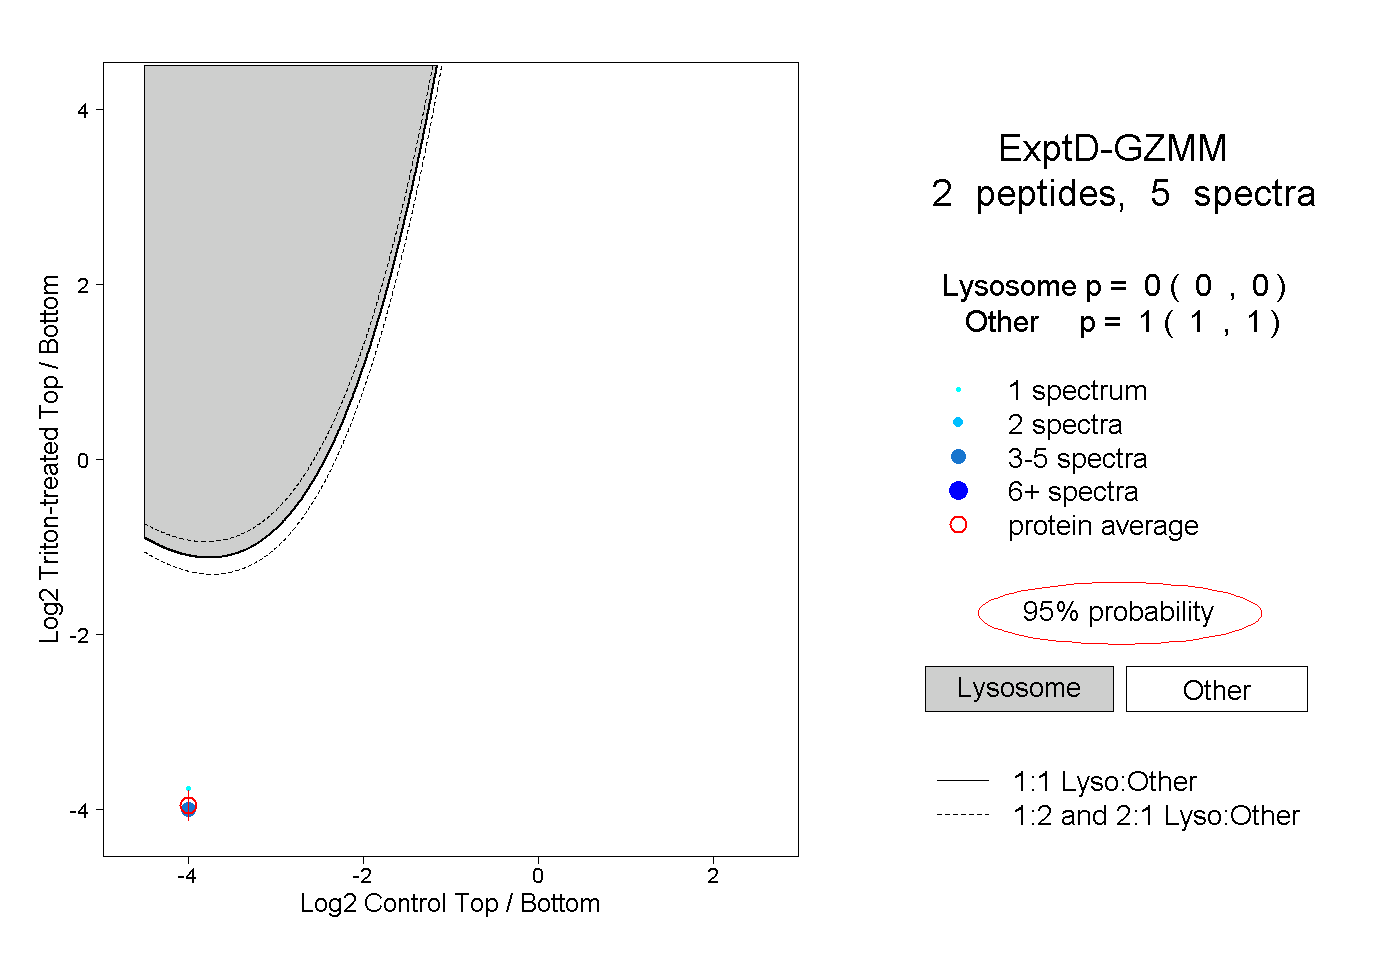
0.000 | 0.000
1.000 | 1.000