 6
6peptides
spectra
0.055 | 0.214
0.027 | 0.164
0.000 | 0.036
0.000 | 0.000
0.000 | 0.066
0.000 | 0.111
0.594 | 0.758
0.000 | 0.072
| Plot | Mito | Lyso | Perox | ER | Golgi | PM | Cytosol | Nucleus | |||||
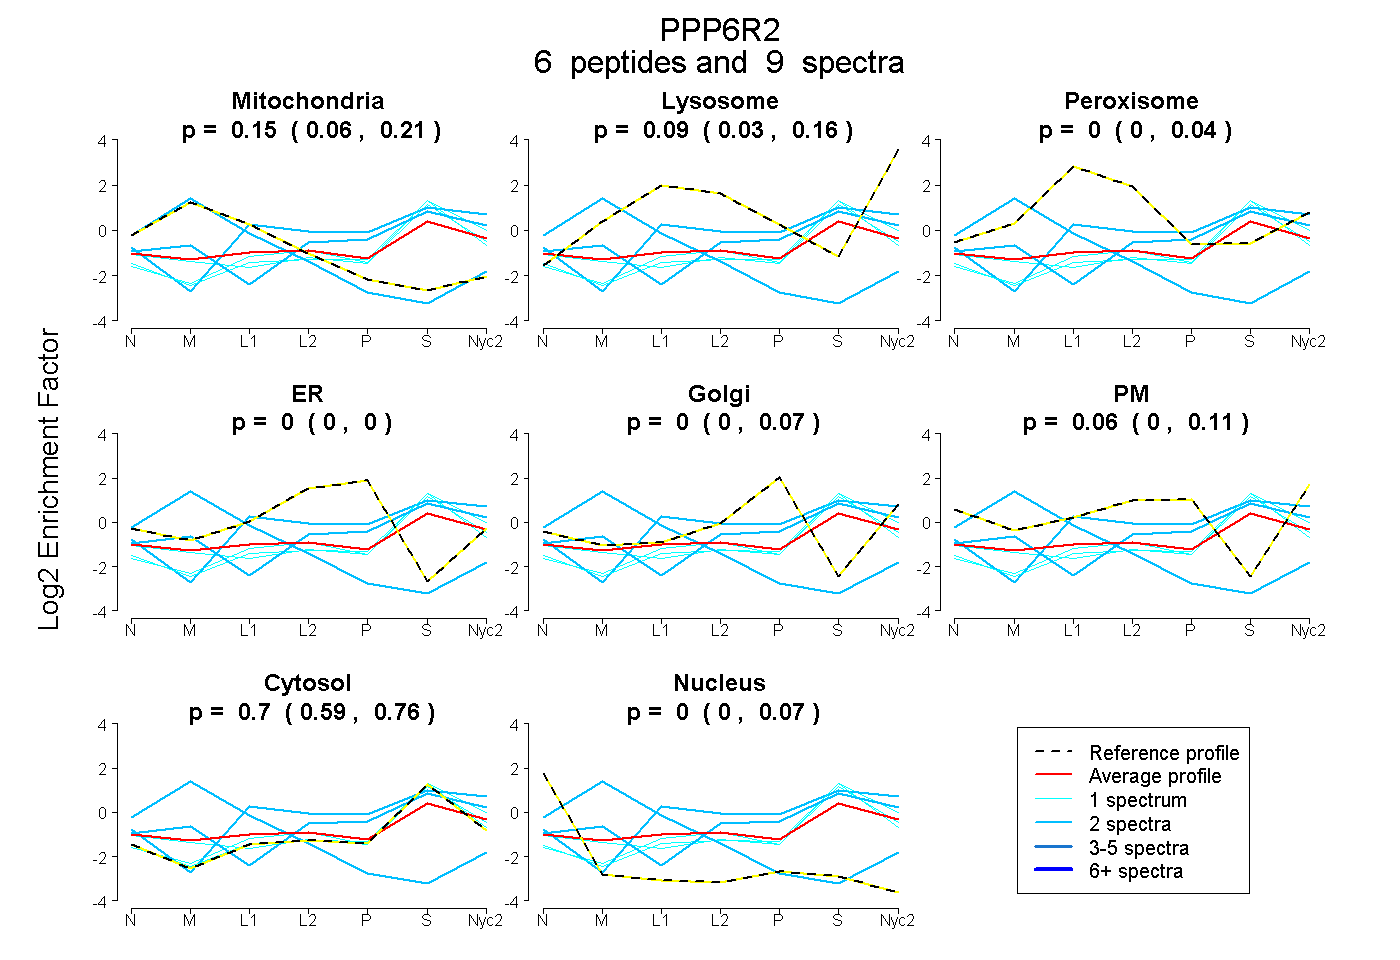
| Expt A |
6 peptides |
9 spectra |
|
0.153 0.055 | 0.214 |
0.090 0.027 | 0.164 |
0.000 0.000 | 0.036 |
0.000 0.000 | 0.000 |
0.000 0.000 | 0.066 |
0.060 0.000 | 0.111 |
0.697 0.594 | 0.758 |
0.000 0.000 | 0.072 |
| 1 spectrum, QEVLHWLNEEK | 0.000 | 0.020 | 0.000 | 0.000 | 0.000 | 0.000 | 0.980 | 0.000 | ||
| 1 spectrum, LLDFLCR | 0.000 | 0.108 | 0.000 | 0.000 | 0.000 | 0.000 | 0.892 | 0.000 | ||
| 2 spectra, TAEAAAGR | 0.959 | 0.000 | 0.000 | 0.000 | 0.000 | 0.000 | 0.000 | 0.041 | ||
| 2 spectra, NFHQLLLNPPK | 0.000 | 0.219 | 0.072 | 0.000 | 0.000 | 0.063 | 0.645 | 0.000 | ||
| 1 spectrum, LVELIHPHQDEDR | 0.101 | 0.046 | 0.000 | 0.000 | 0.000 | 0.000 | 0.853 | 0.000 | ||
| 2 spectra, VGTEGLVDSFSQGLER | 0.000 | 0.044 | 0.000 | 0.000 | 0.197 | 0.069 | 0.690 | 0.000 |
| Plot | Mito | Lyso or Perox | ER | Golgi | PM | Cytosol | Nucleus | ||||||
| Expt B |
2 peptides |
3 spectra |
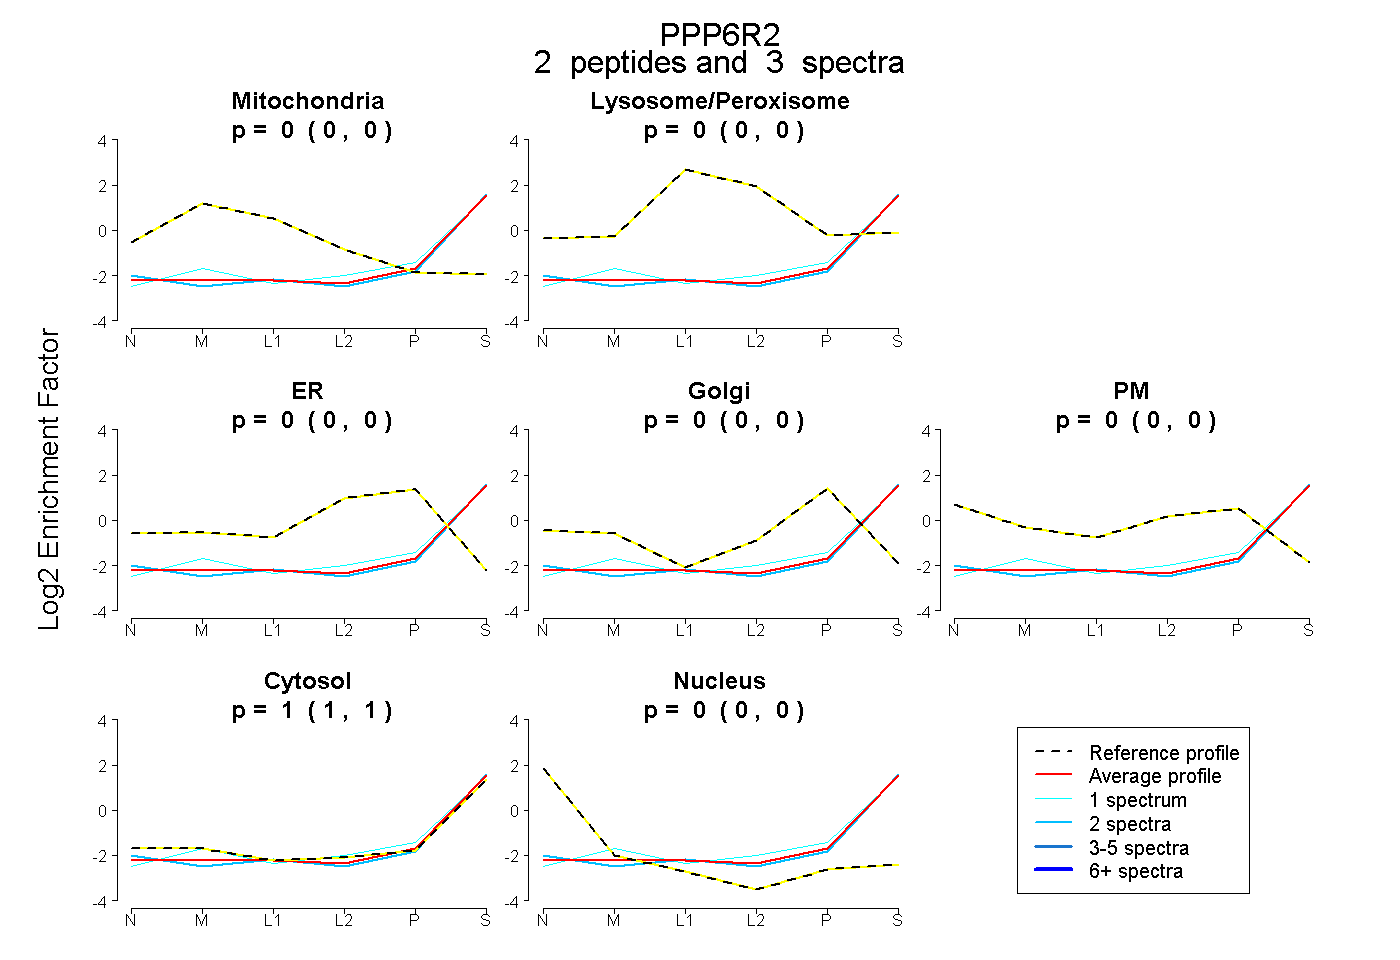 |
0.000 0.000 | 0.000 |
0.000 0.000 | 0.000 |
0.000 0.000 | 0.000 |
0.000 0.000 | 0.000 |
0.000 0.000 | 0.000 |
1.000 1.000 | 1.000 |
0.000 0.000 | 0.000 |
|||
| Plot | Lyso | Other | |||||||||||
| Expt C |
3 peptides |
4 spectra |
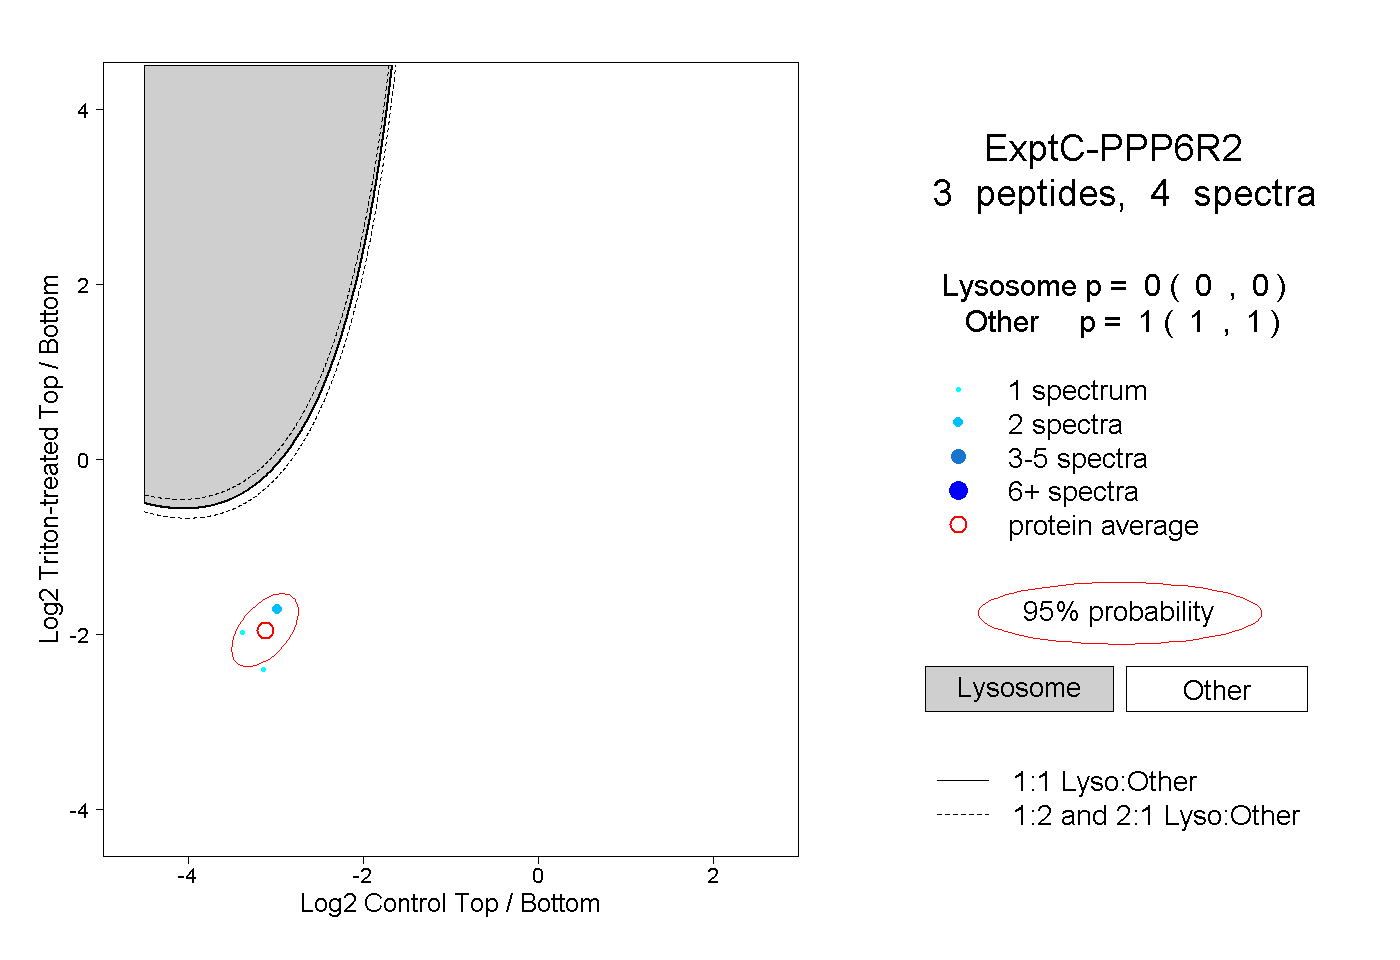 |
0.000 0.000 | 0.000 |
1.000 1.000 | 1.000 |