10
10peptides
spectra
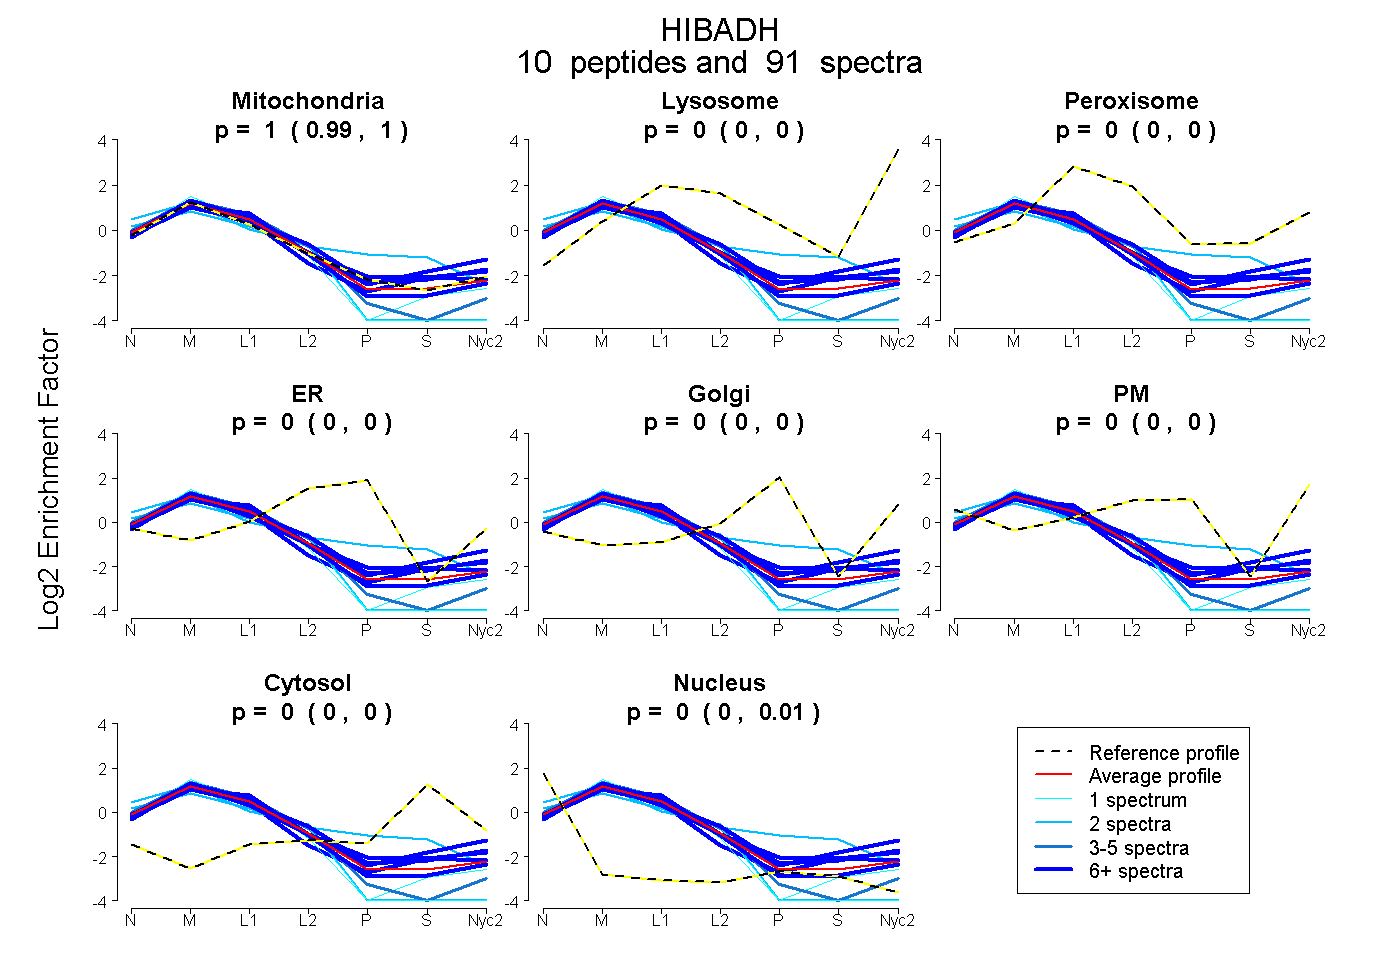
0.992 | 0.998
0.000 | 0.000
0.000 | 0.001
0.000 | 0.000
0.000 | 0.000
0.000 | 0.000
0.000 | 0.000
0.002 | 0.007
8peptides
spectra
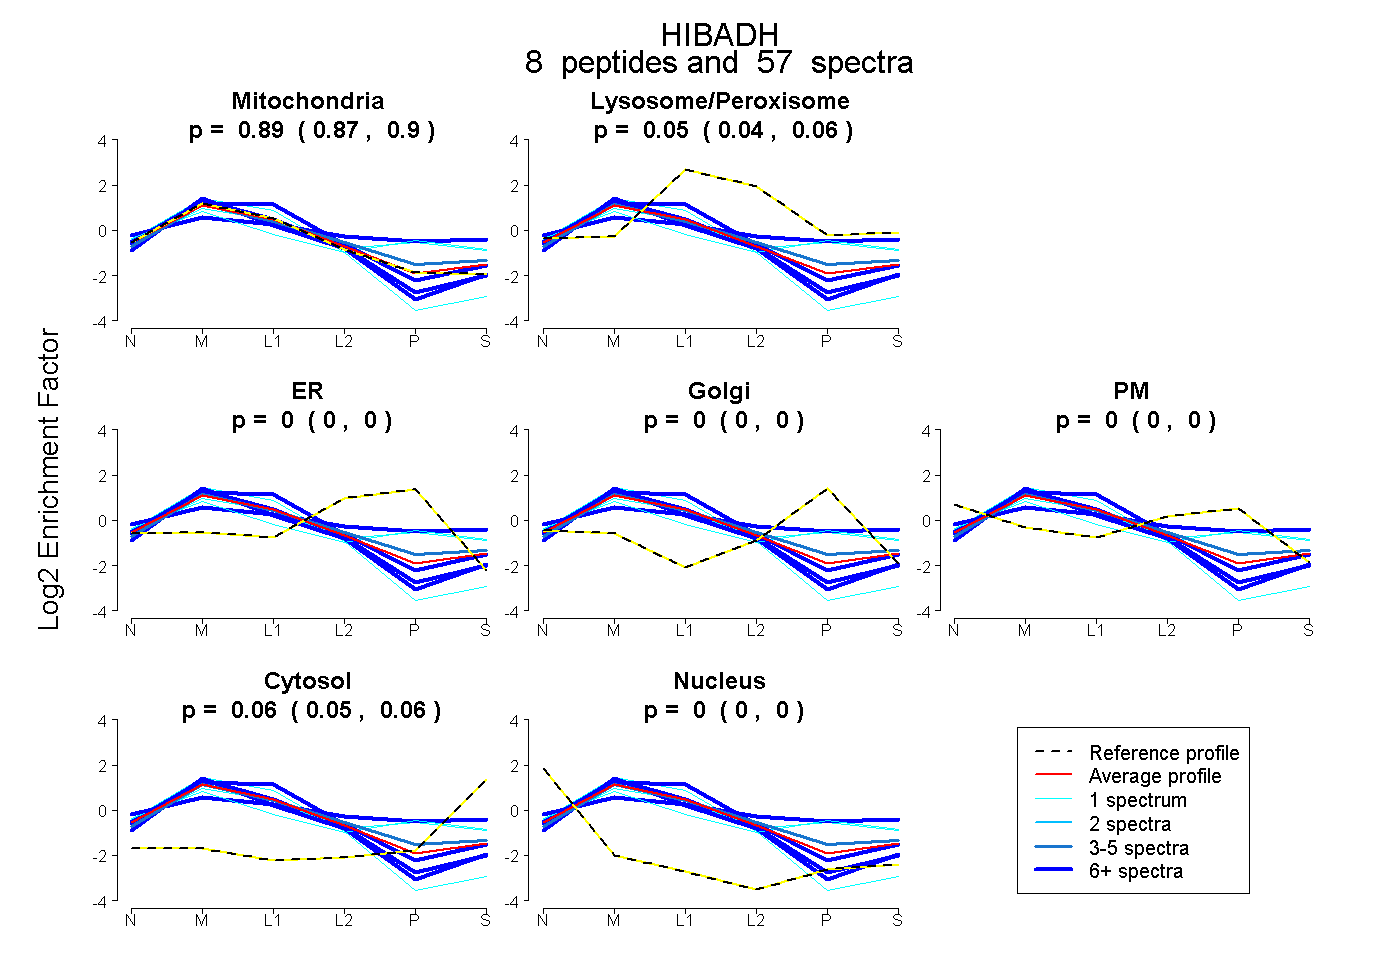
0.872 | 0.904
0.041 | 0.063
0.000 | 0.000
0.000 | 0.000
0.000 | 0.000
0.049 | 0.065
0.000 | 0.000