 10
10peptides
spectra
0.992 | 0.998
0.000 | 0.000
0.000 | 0.001
0.000 | 0.000
0.000 | 0.000
0.000 | 0.000
0.000 | 0.000
0.002 | 0.007
| Plot | Mito | Lyso | Perox | ER | Golgi | PM | Cytosol | Nucleus | |||||
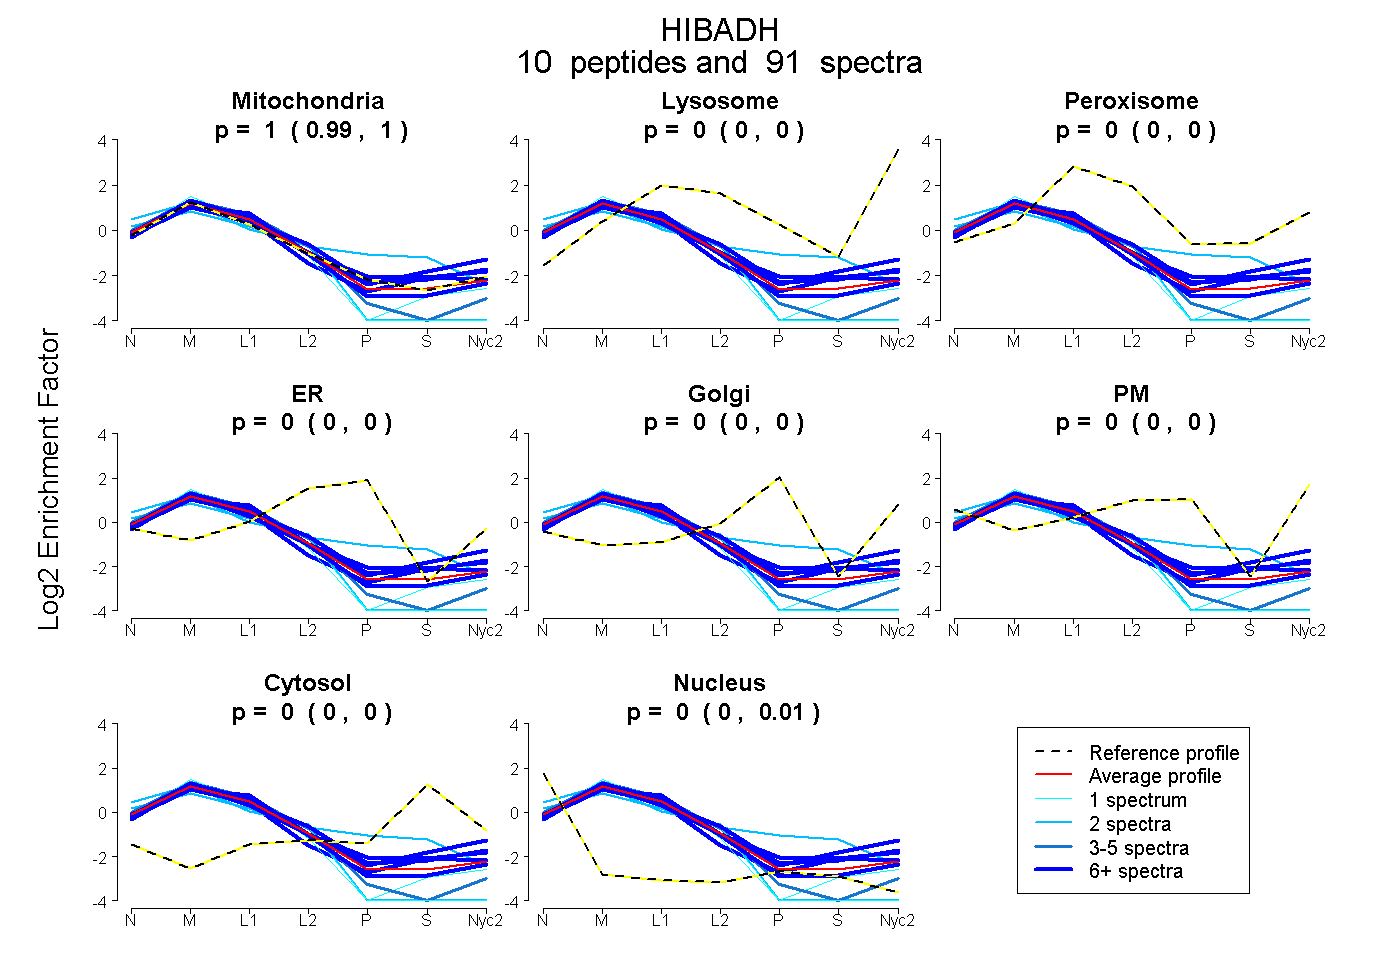
| Expt A |
10 peptides |
91 spectra |
|
0.996 0.992 | 0.998 |
0.000 0.000 | 0.000 |
0.000 0.000 | 0.001 |
0.000 0.000 | 0.000 |
0.000 0.000 | 0.000 |
0.000 0.000 | 0.000 |
0.000 0.000 | 0.000 |
0.004 0.002 | 0.007 |
| 19 spectra, TPVGFIGLGNMGNPMAK | 1.000 | 0.000 | 0.000 | 0.000 | 0.000 | 0.000 | 0.000 | 0.000 | ||
| 11 spectra, DFSSVFQYLR | 0.948 | 0.000 | 0.000 | 0.000 | 0.000 | 0.000 | 0.052 | 0.000 | ||
| 2 spectra, DLGLAQDSATSTK | 0.713 | 0.000 | 0.031 | 0.100 | 0.000 | 0.000 | 0.156 | 0.000 | ||
| 1 spectrum, GSLLIDSSTIDPSVSK | 0.985 | 0.000 | 0.000 | 0.000 | 0.000 | 0.000 | 0.000 | 0.015 | ||
| 13 spectra, TPILLGSVAHQIYR | 0.887 | 0.000 | 0.077 | 0.000 | 0.000 | 0.000 | 0.023 | 0.013 | ||
| 2 spectra, EAGEQVASSPADVAEK | 0.854 | 0.000 | 0.000 | 0.000 | 0.000 | 0.000 | 0.000 | 0.146 | ||
| 5 spectra, HGYPLILYDVFPDVCK | 0.987 | 0.000 | 0.000 | 0.000 | 0.000 | 0.000 | 0.000 | 0.013 | ||
| 28 spectra, ILNMSSGR | 0.836 | 0.065 | 0.014 | 0.000 | 0.000 | 0.000 | 0.085 | 0.000 | ||
| 1 spectrum, IITMLPSSMNSIEVYSGANGILK | 0.947 | 0.000 | 0.000 | 0.000 | 0.000 | 0.000 | 0.000 | 0.053 | ||
| 9 spectra, MGAVFMDAPVSGGVGAAR | 0.859 | 0.000 | 0.101 | 0.000 | 0.000 | 0.000 | 0.039 | 0.001 |
| Plot | Mito | Lyso or Perox | ER | Golgi | PM | Cytosol | Nucleus | ||||||
| Expt B |
8 peptides |
57 spectra |
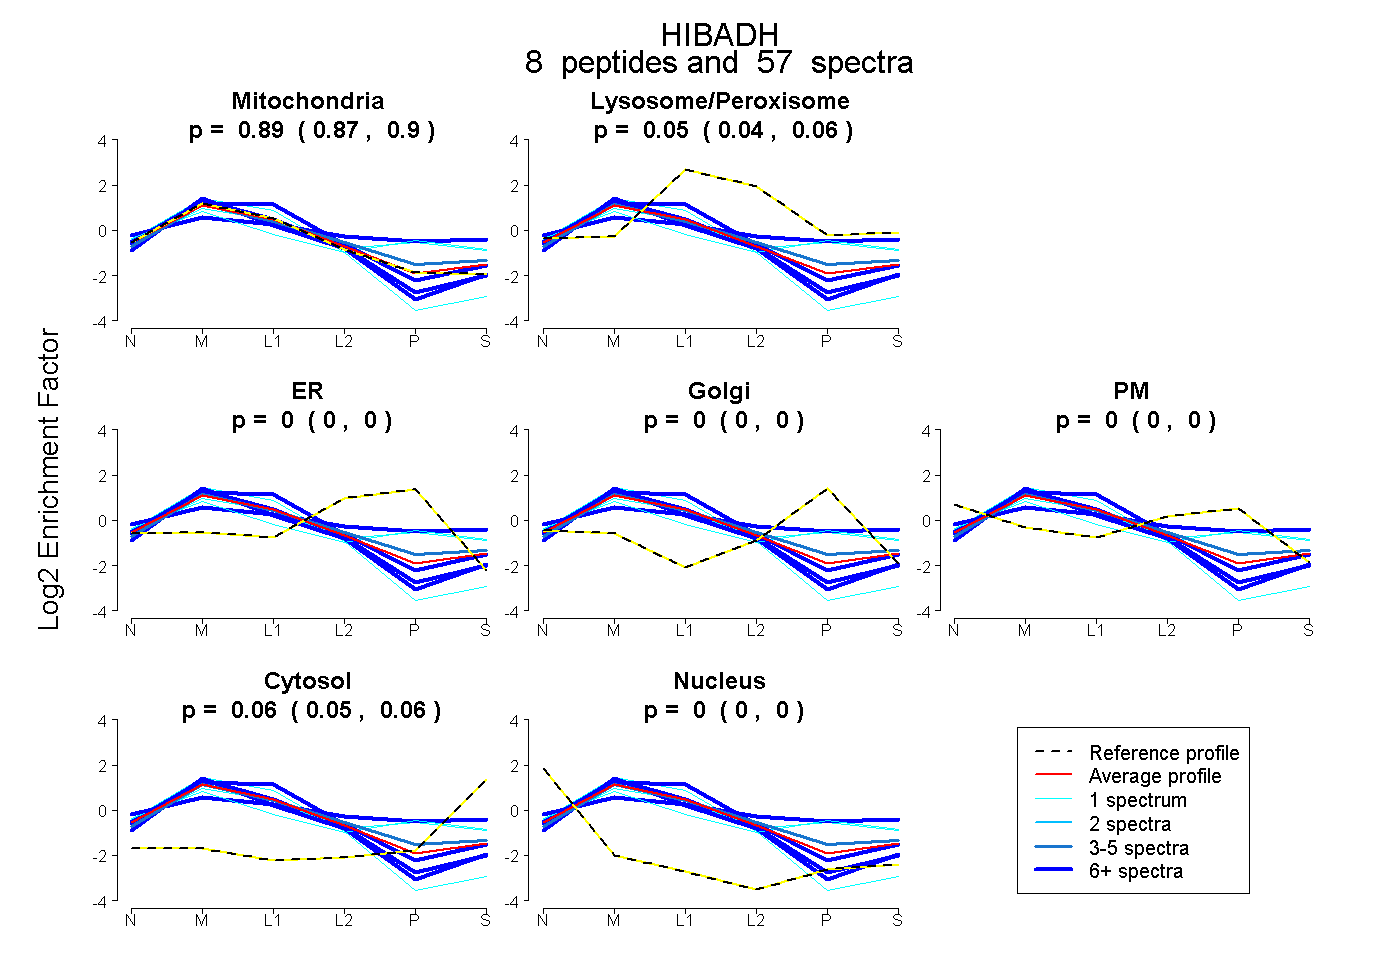 |
0.889 0.872 | 0.904 |
0.053 0.041 | 0.063 |
0.000 0.000 | 0.000 |
0.000 0.000 | 0.000 |
0.000 0.000 | 0.000 |
0.058 0.049 | 0.065 |
0.000 0.000 | 0.000 |
|||
| Plot | Lyso | Other | |||||||||||
| Expt C |
11 peptides |
260 spectra |
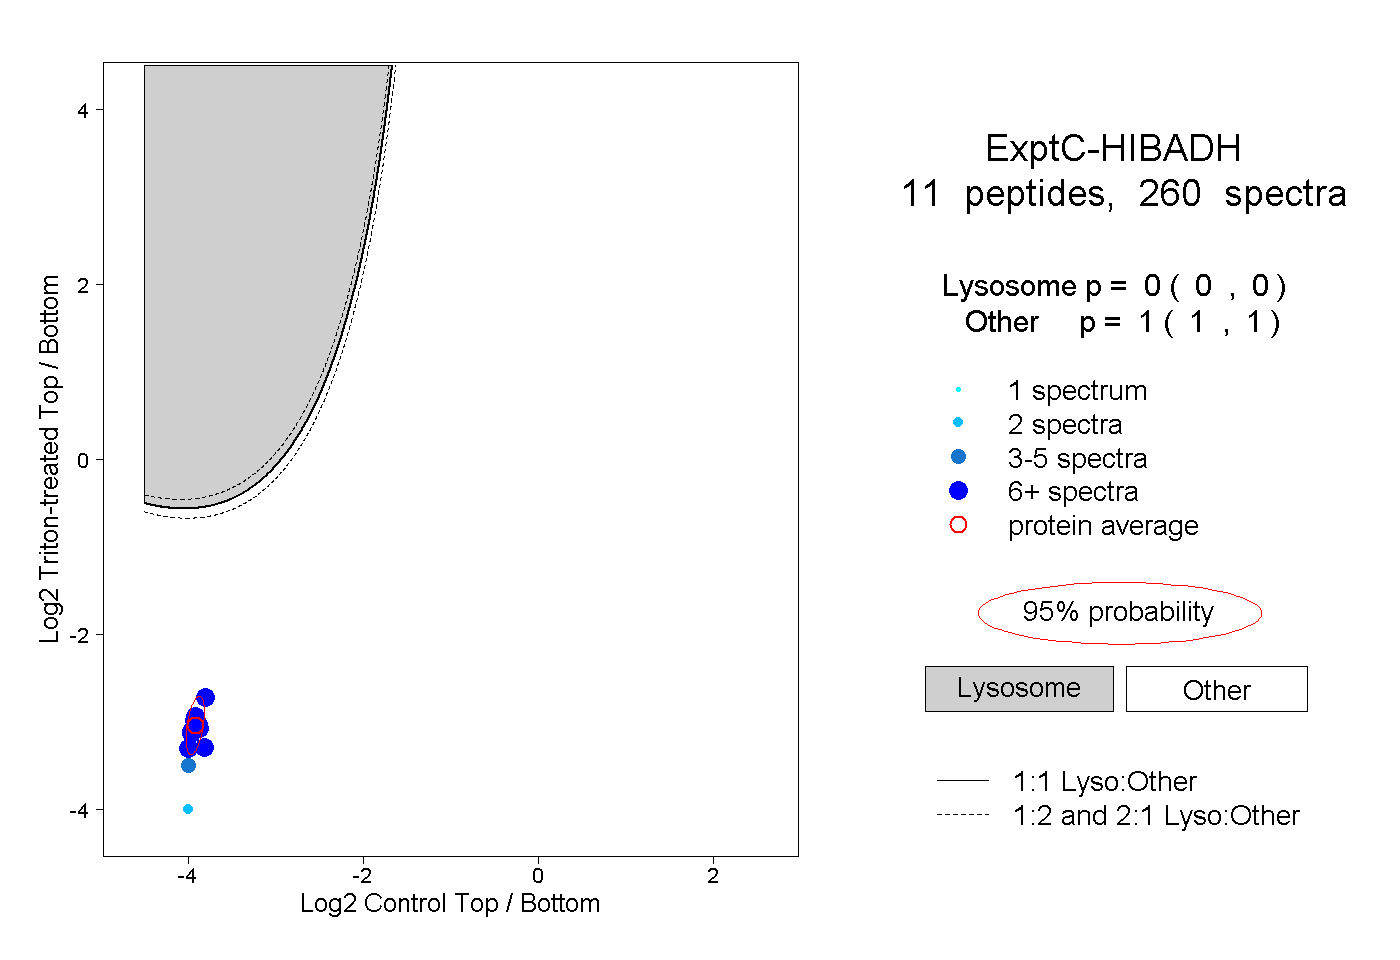 |
0.000 0.000 | 0.000 |
1.000 1.000 | 1.000 |
||||||||
| Plot | Lyso | Other | |||||||||||
| Expt D |
5 peptides |
15 spectra |
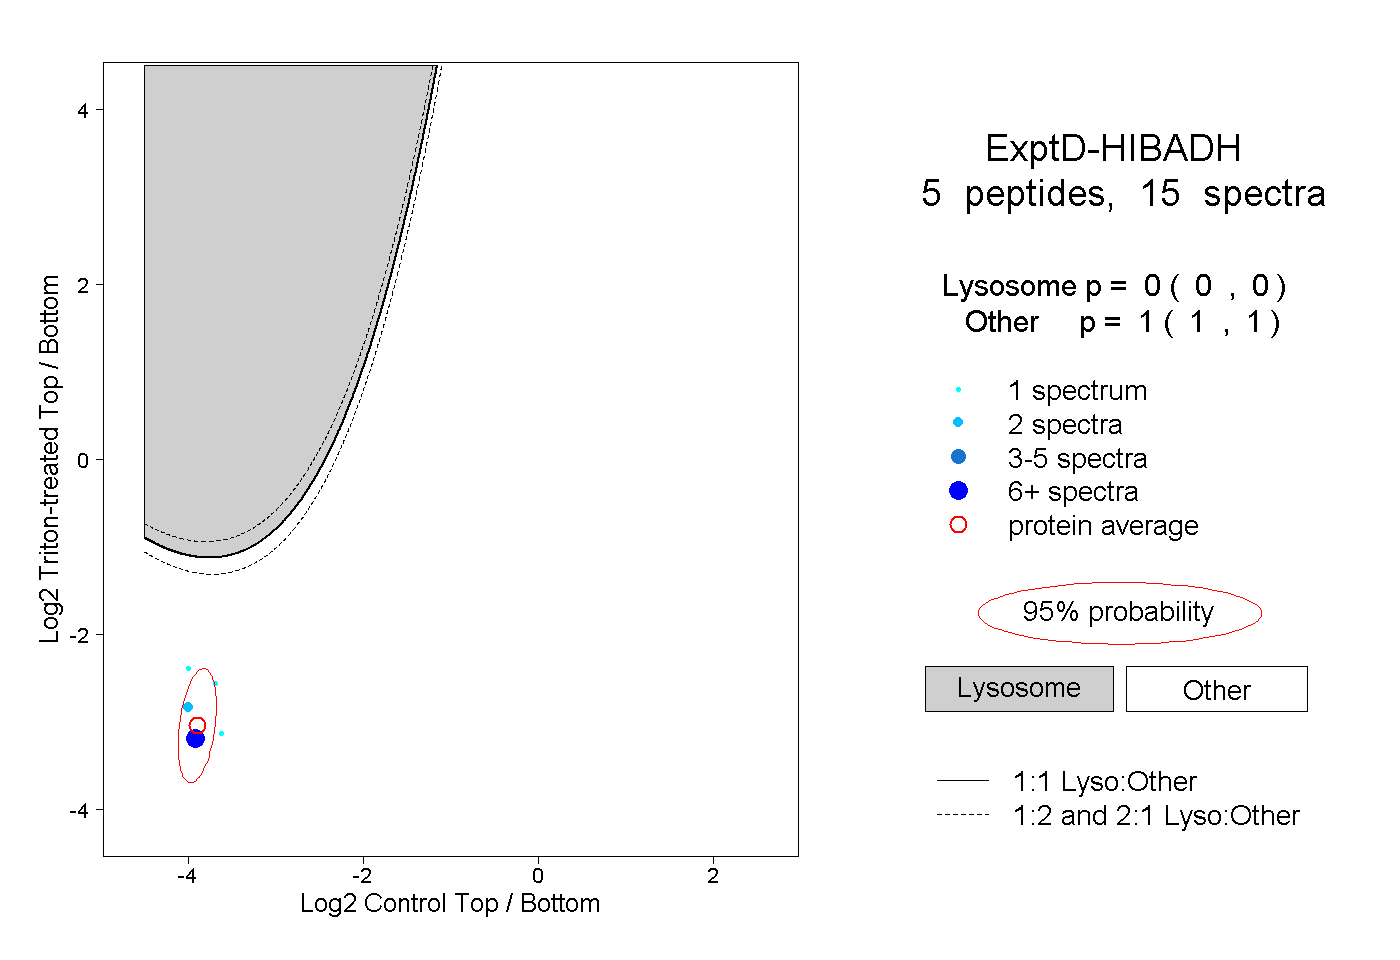 |
0.000 0.000 | 0.000 |
1.000 1.000 | 1.000 |