VAMP7
[ENSRNOP00000011065]
Main page
| | | Plot |
Mito |
Lyso |
|
Perox |
ER |
Golgi |
PM |
Cytosol |
Nucleus |
|
| Expt A |
 8
8
peptides |
21
spectra |
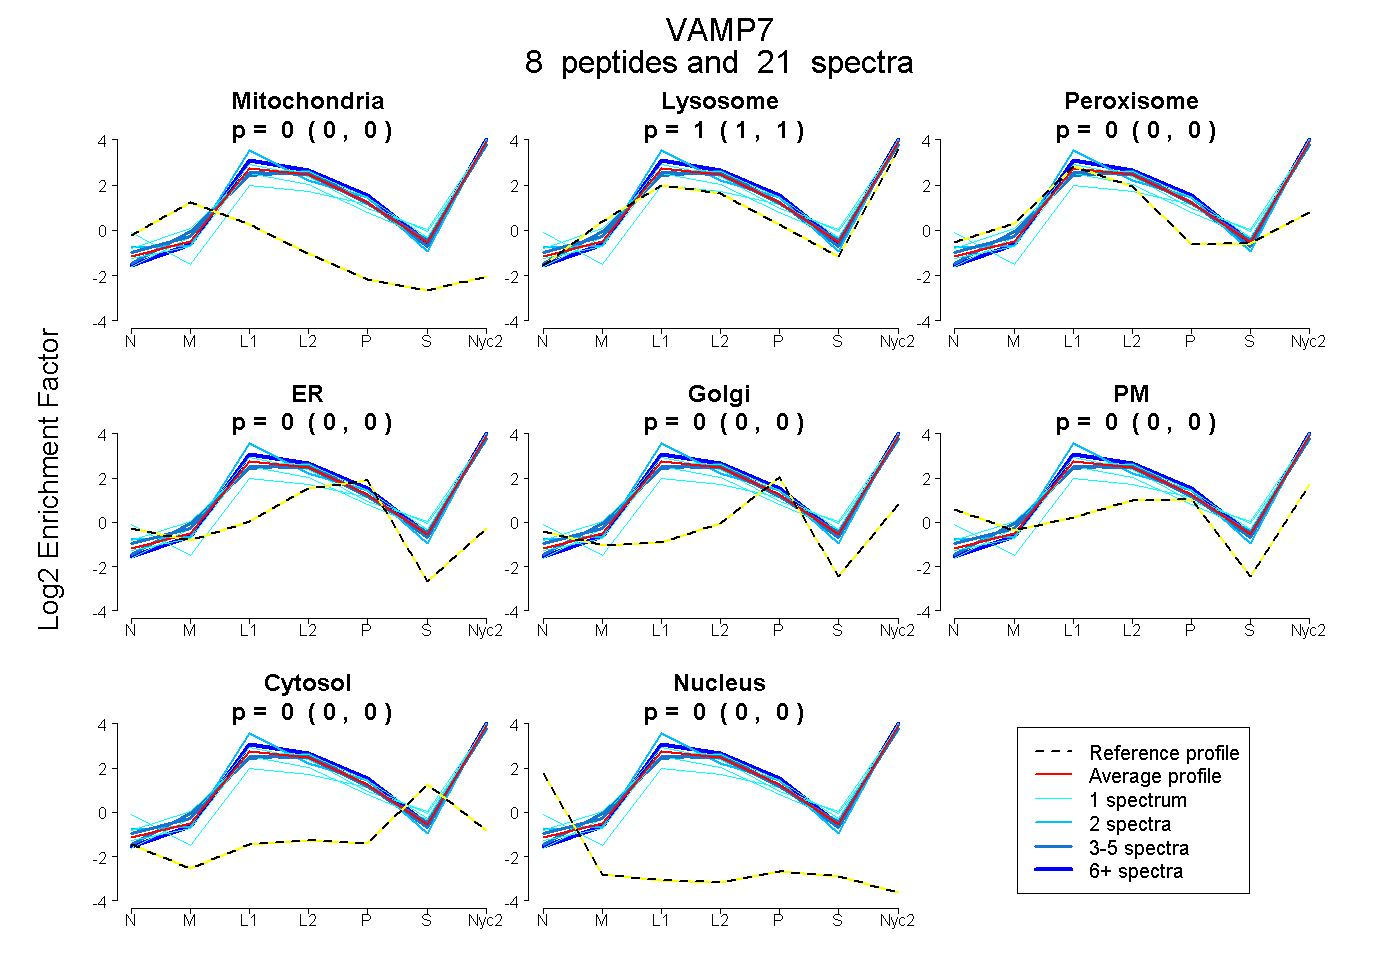 |
0.000
0.000 | 0.000 |
1.000
1.000 | 1.000 |
|
0.000
0.000 | 0.000 |
0.000
0.000 | 0.000 |
0.000
0.000 | 0.000 |
0.000
0.000 | 0.000 |
0.000
0.000 | 0.000 |
0.000
0.000 | 0.000 |
|
| | | Plot |
Mito |
|
Lyso or Perox |
|
ER |
Golgi |
PM |
Cytosol |
Nucleus |
|
| Expt B |
6
peptides |
17
spectra |
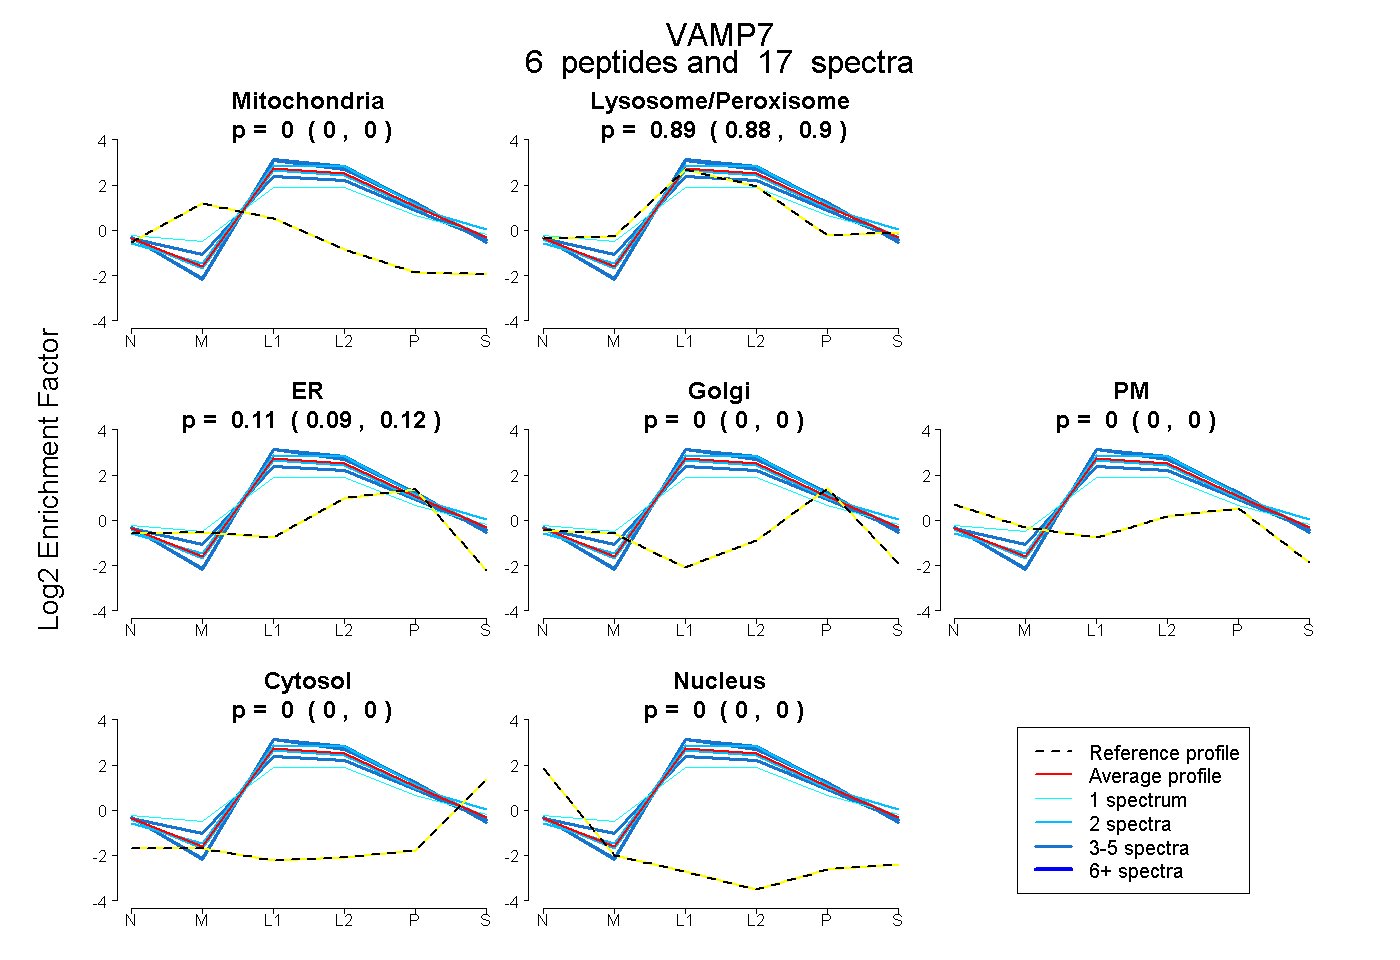 |
0.000
0.000 | 0.000 |
|
0.890
0.876 | 0.903 |
|
0.110
0.094 | 0.122 |
0.000
0.000 | 0.000 |
0.000
0.000 | 0.000 |
0.000
0.000 | 0.000 |
0.000
0.000 | 0.000 |
|
| 2 spectra, LELLIDK |
0.000 |
|
0.924 |
|
0.076 |
0.000 |
0.000 |
0.000 |
0.000 |
|
| 3 spectra, AILFAVVAR |
0.000 |
|
0.944 |
|
0.056 |
0.000 |
0.000 |
0.000 |
0.000 |
|
| 2 spectra, NIDLVAQR |
0.000 |
|
0.915 |
|
0.085 |
0.000 |
0.000 |
0.000 |
0.000 |
|
| 1 spectrum, VTETQAQVDELK |
0.000 |
|
0.779 |
|
0.221 |
0.000 |
0.000 |
0.000 |
0.000 |
|
| 5 spectra, FQTTYGSR |
0.000 |
|
0.829 |
|
0.171 |
0.000 |
0.000 |
0.000 |
0.000 |
|
| 4 spectra, AFGFLNEVK |
0.000 |
|
0.920 |
|
0.080 |
0.000 |
0.000 |
0.000 |
0.000 |
|
| | | Plot |
|
Lyso |
|
|
|
|
|
|
|
Other |
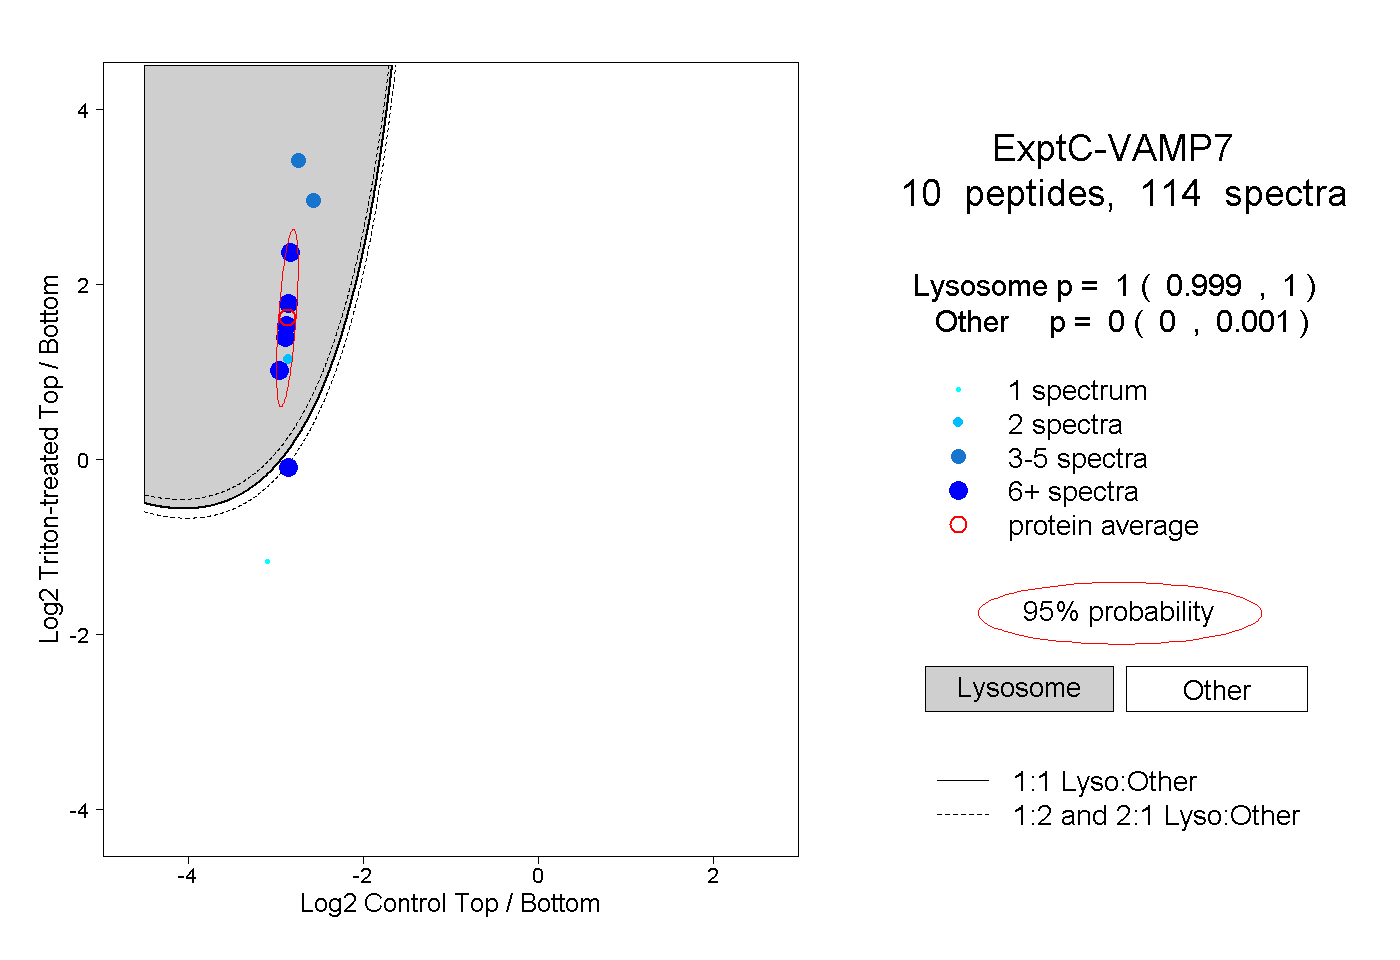
| Expt C |
10
peptides |
114
spectra |
 |
|
1.000
0.999 | 1.000 |
|
|
|
|
|
|
|
0.000
0.000 | 0.001 |
| | | Plot |
|
Lyso |
|
|
|
|
|
|
|
Other |
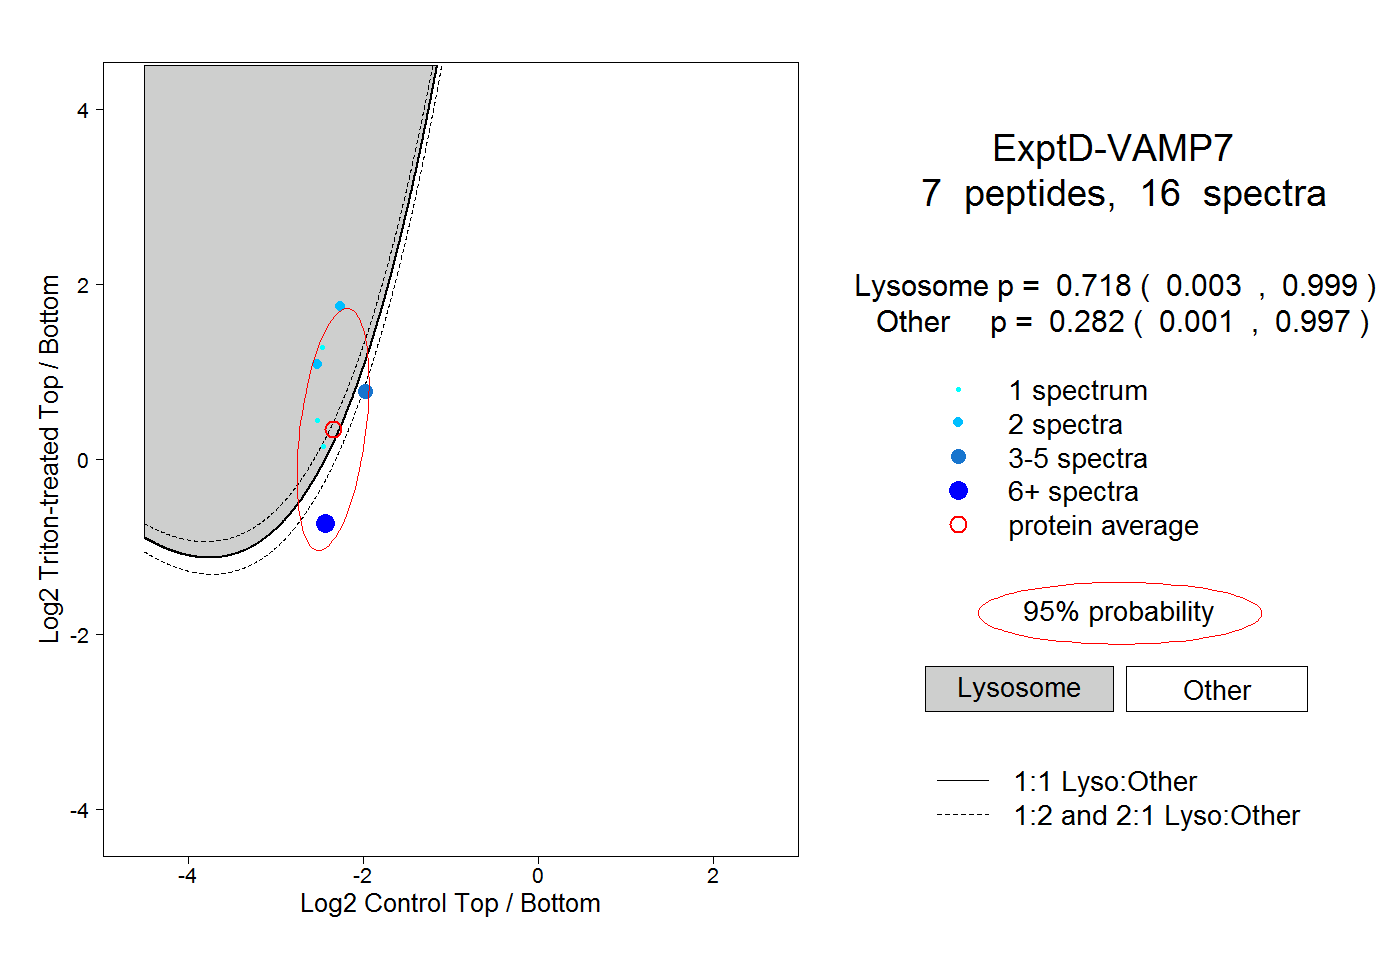
| Expt D |
7
peptides |
16
spectra |
 |
|
0.718
0.003 | 0.999 |
|
|
|
|
|
|
|
0.282
0.001 | 0.997 |