 8
8peptides
spectra
0.000 | 0.000
1.000 | 1.000
0.000 | 0.000
0.000 | 0.000
0.000 | 0.000
0.000 | 0.000
0.000 | 0.000
0.000 | 0.000
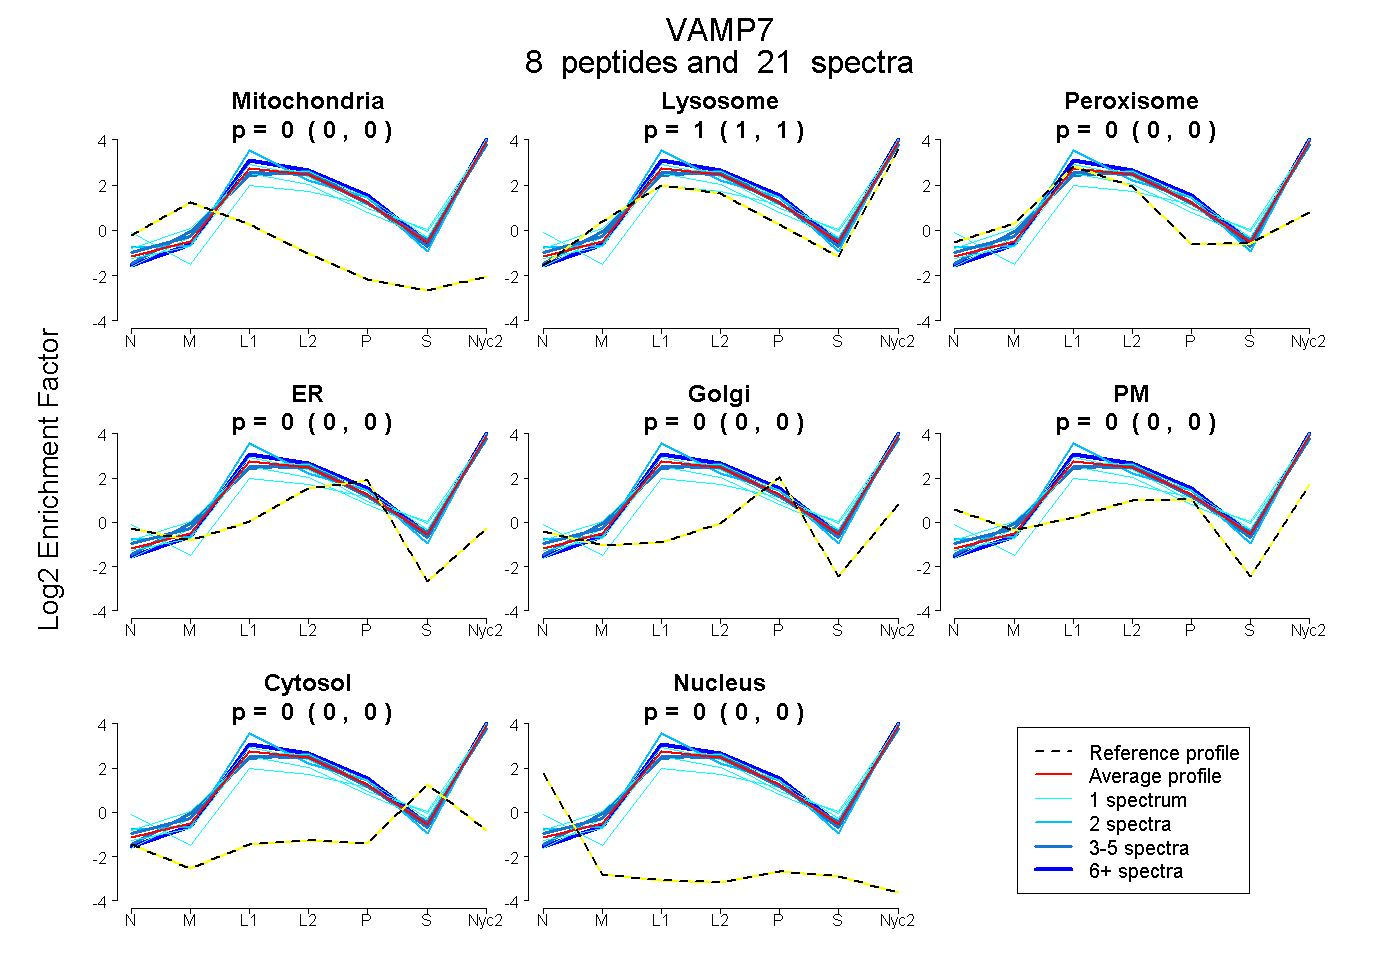
| Plot | Mito | Lyso | Perox | ER | Golgi | PM | Cytosol | Nucleus | |||||
| Expt A |
8 peptides |
21 spectra |
|
0.000 0.000 | 0.000 |
1.000 1.000 | 1.000 |
0.000 0.000 | 0.000 |
0.000 0.000 | 0.000 |
0.000 0.000 | 0.000 |
0.000 0.000 | 0.000 |
0.000 0.000 | 0.000 |
0.000 0.000 | 0.000 |
| 1 spectrum, LELLIDK | 0.000 | 0.990 | 0.010 | 0.000 | 0.000 | 0.000 | 0.000 | 0.000 | ||
| 1 spectrum, HAWCGGNFLEVTEQILAK | 0.000 | 0.992 | 0.008 | 0.000 | 0.000 | 0.000 | 0.000 | 0.000 | ||
| 3 spectra, NIDLVAQR | 0.000 | 0.972 | 0.028 | 0.000 | 0.000 | 0.000 | 0.000 | 0.000 | ||
| 1 spectrum, TENLVDSSVTFK | 0.000 | 1.000 | 0.000 | 0.000 | 0.000 | 0.000 | 0.000 | 0.000 | ||
| 1 spectrum, IPSENNK | 0.000 | 0.758 | 0.000 | 0.000 | 0.000 | 0.176 | 0.066 | 0.000 | ||
| 7 spectra, AILFAVVAR | 0.000 | 1.000 | 0.000 | 0.000 | 0.000 | 0.000 | 0.000 | 0.000 | ||
| 2 spectra, HHSENQSLDR | 0.000 | 0.977 | 0.023 | 0.000 | 0.000 | 0.000 | 0.000 | 0.000 | ||
| 5 spectra, FQTTYGSR | 0.000 | 1.000 | 0.000 | 0.000 | 0.000 | 0.000 | 0.000 | 0.000 |
| Plot | Mito | Lyso or Perox | ER | Golgi | PM | Cytosol | Nucleus | ||||||
| Expt B |
6 peptides |
17 spectra |
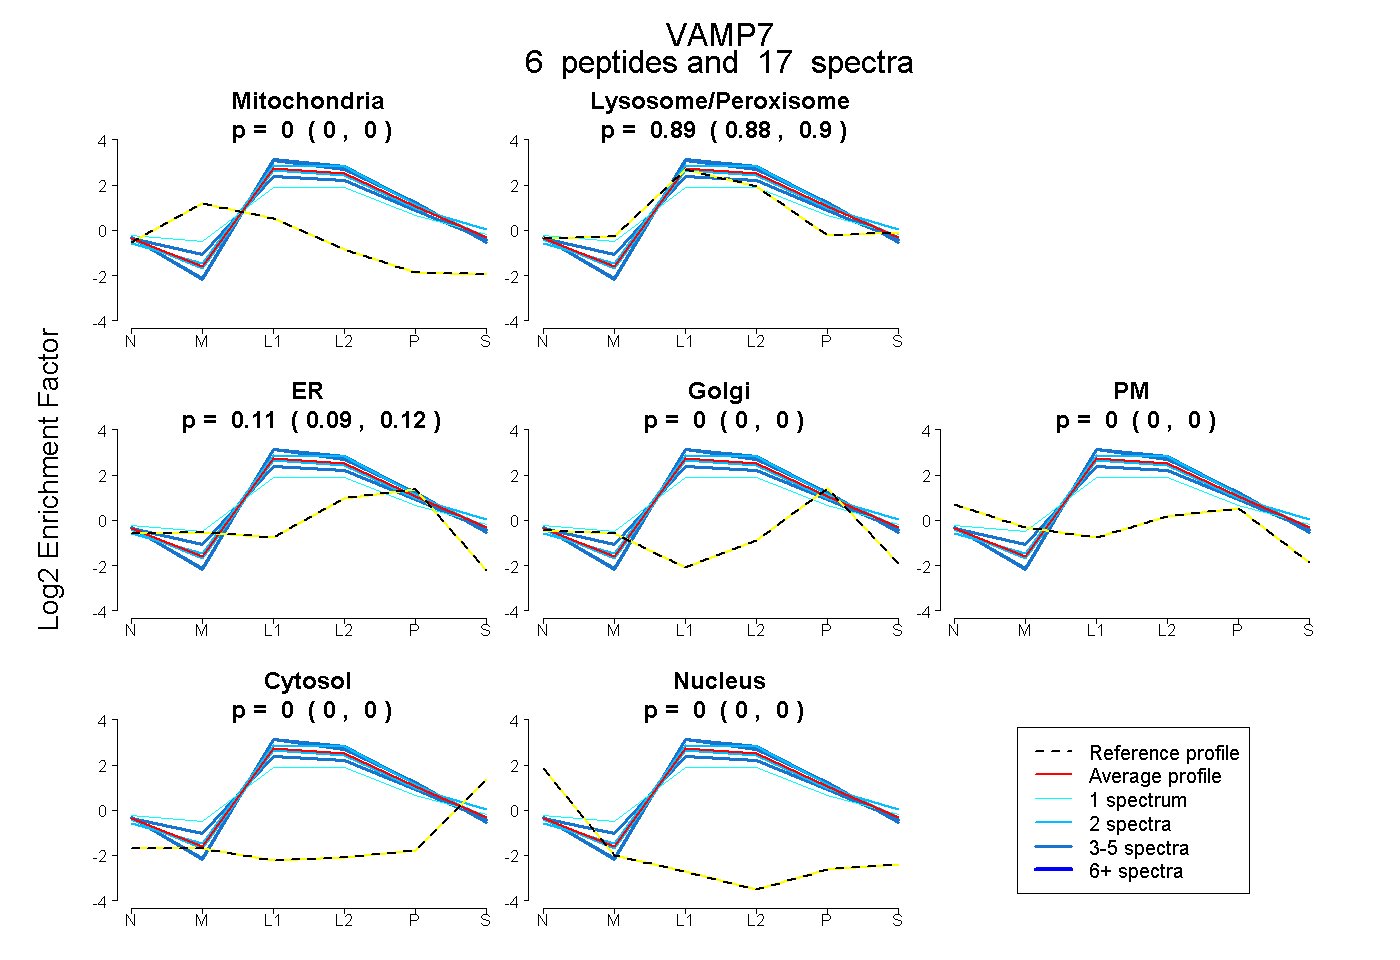 |
0.000 0.000 | 0.000 |
0.890 0.876 | 0.903 |
0.110 0.094 | 0.122 |
0.000 0.000 | 0.000 |
0.000 0.000 | 0.000 |
0.000 0.000 | 0.000 |
0.000 0.000 | 0.000 |
|||
| Plot | Lyso | Other | |||||||||||
| Expt C |
10 peptides |
114 spectra |
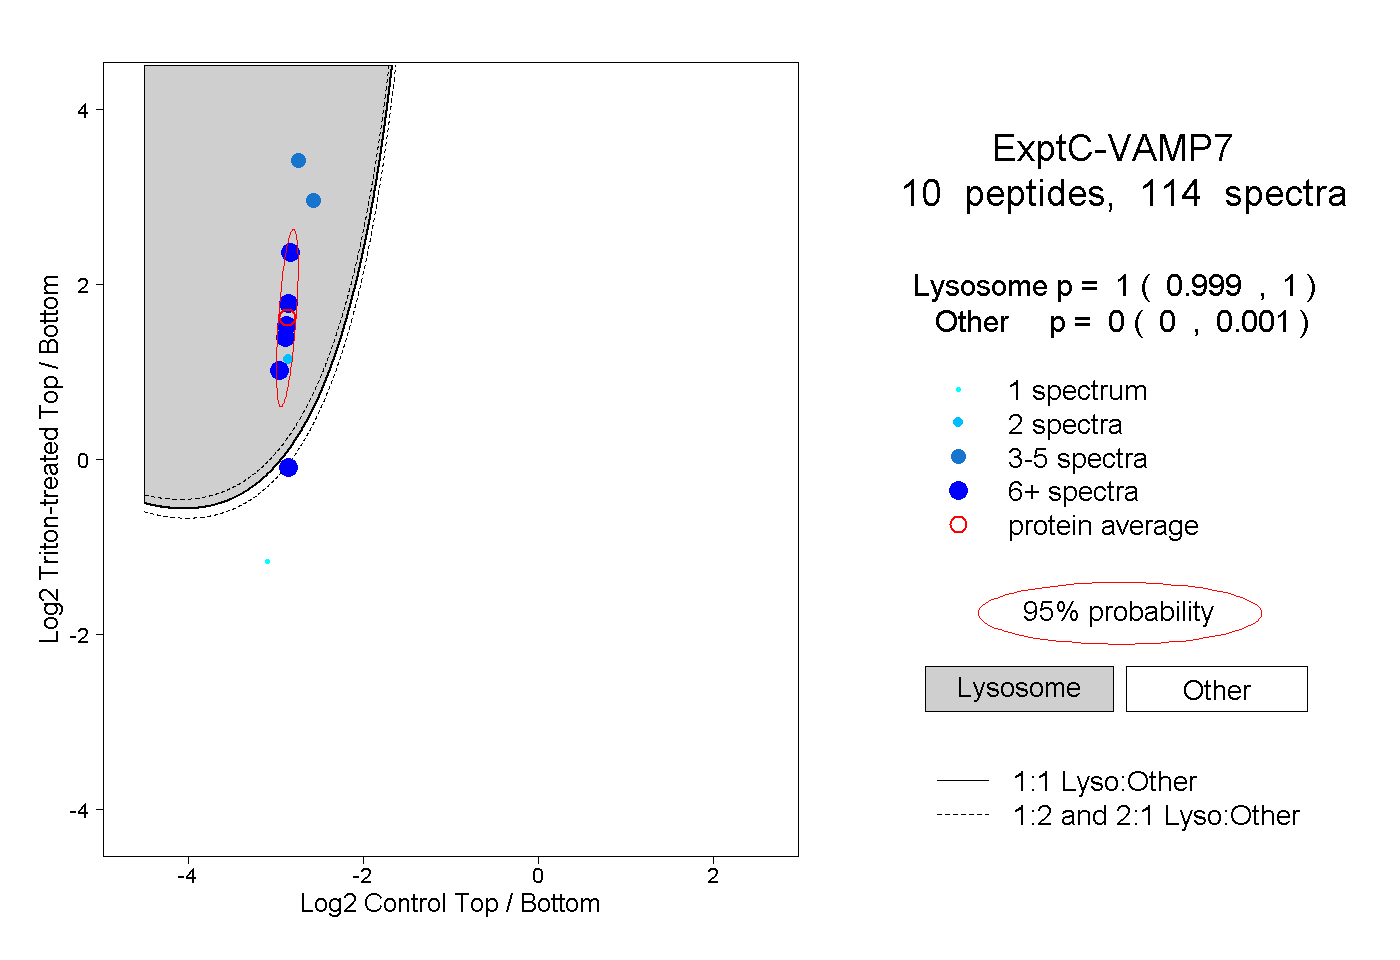 |
1.000 0.999 | 1.000 |
0.000 0.000 | 0.001 |
||||||||
| Plot | Lyso | Other | |||||||||||
| Expt D |
7 peptides |
16 spectra |
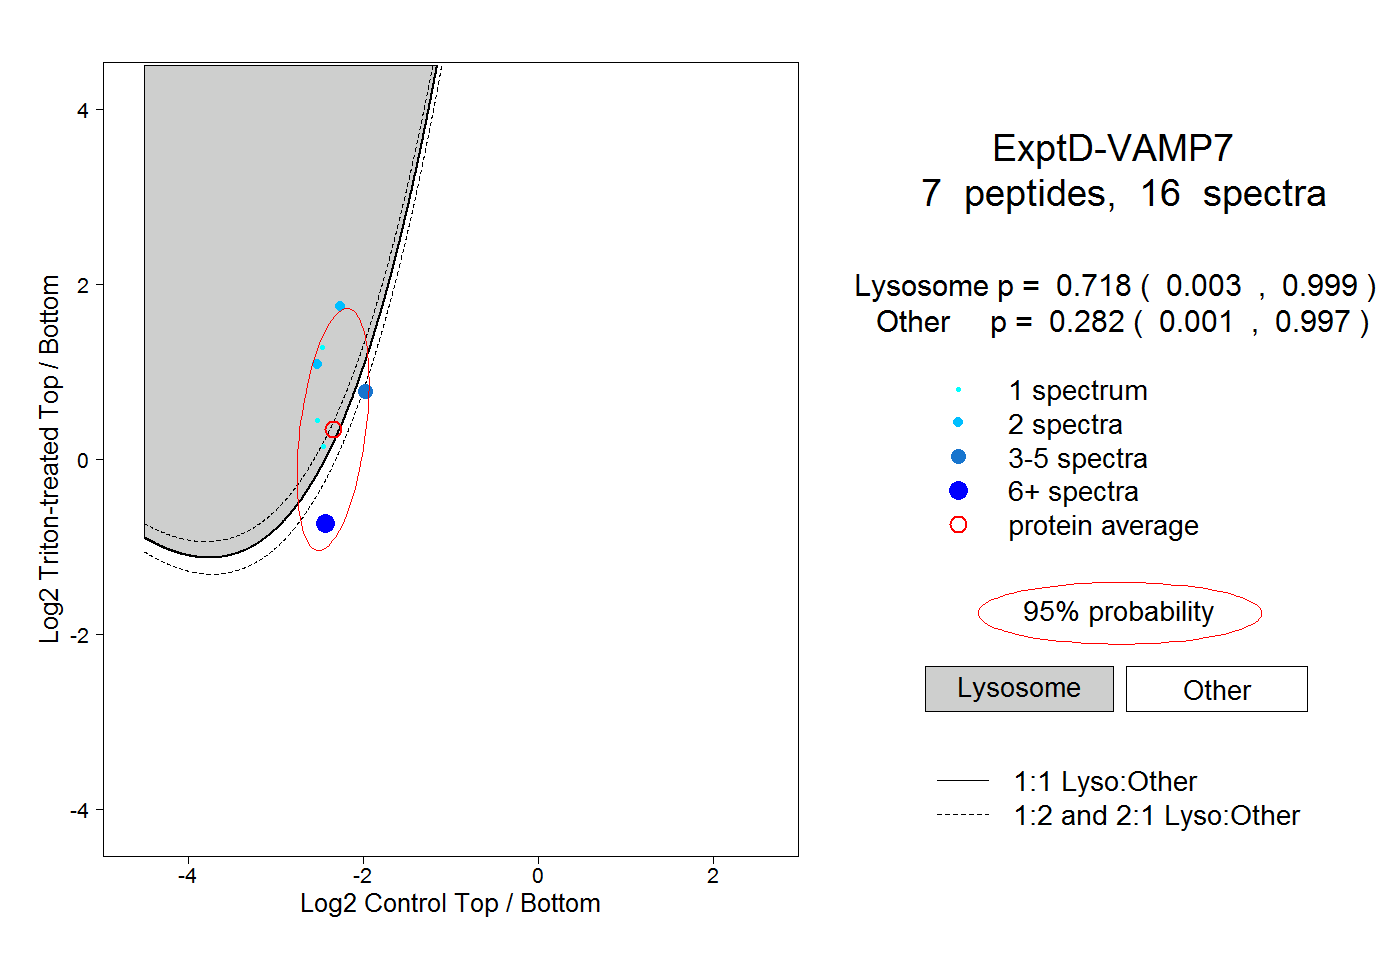 |
0.718 0.003 | 0.999 |
0.282 0.001 | 0.997 |