 6
6peptides
spectra
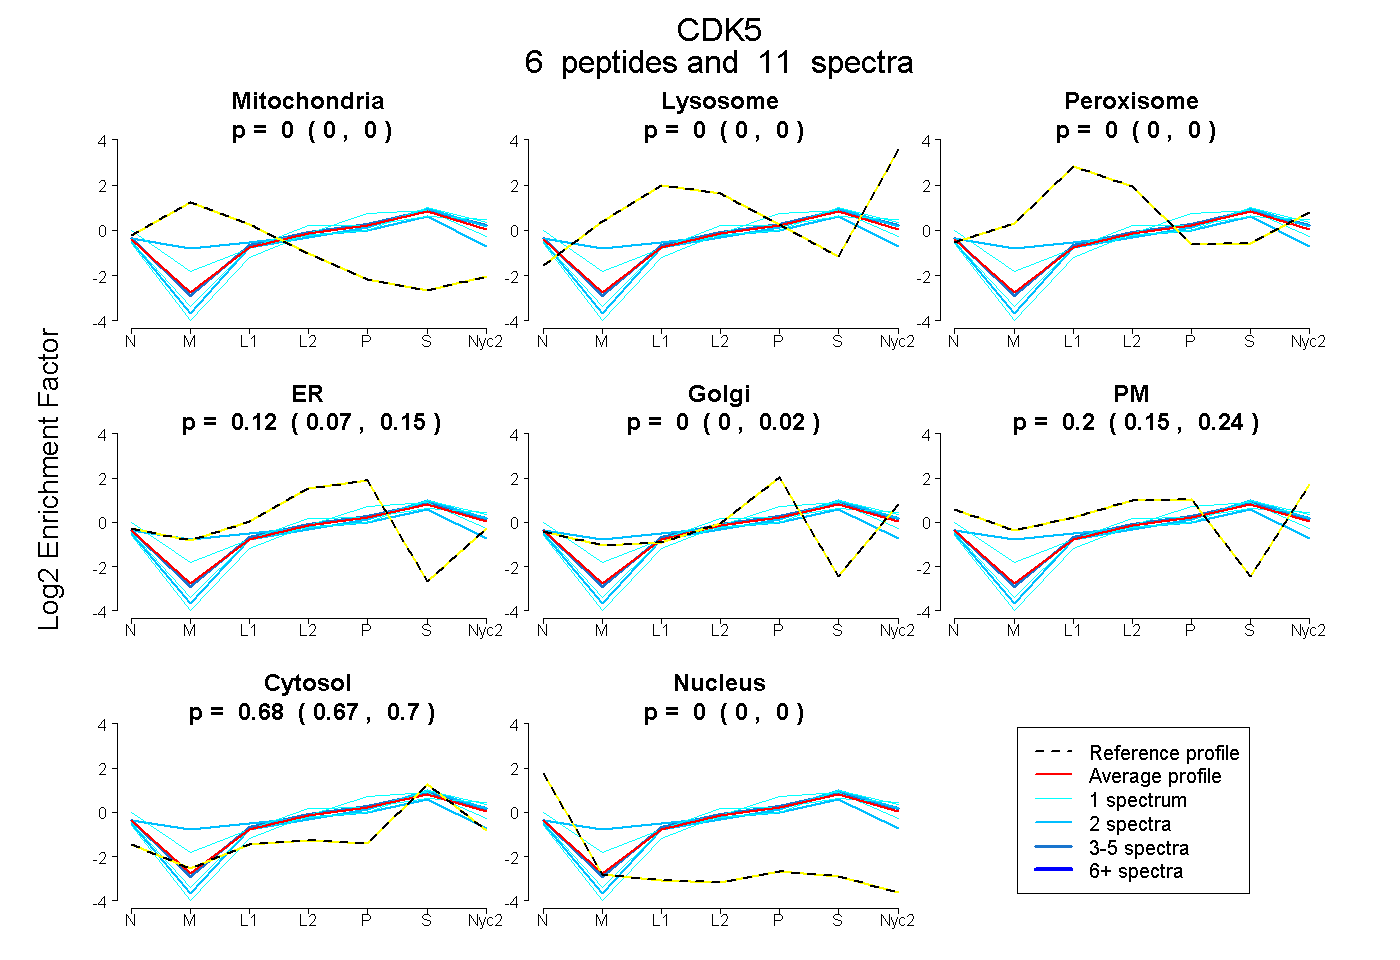
0.000 | 0.000
0.000 | 0.000
0.000 | 0.000
0.072 | 0.147
0.000 | 0.021
0.150 | 0.238
0.668 | 0.697
0.000 | 0.000
1peptide
spectrum
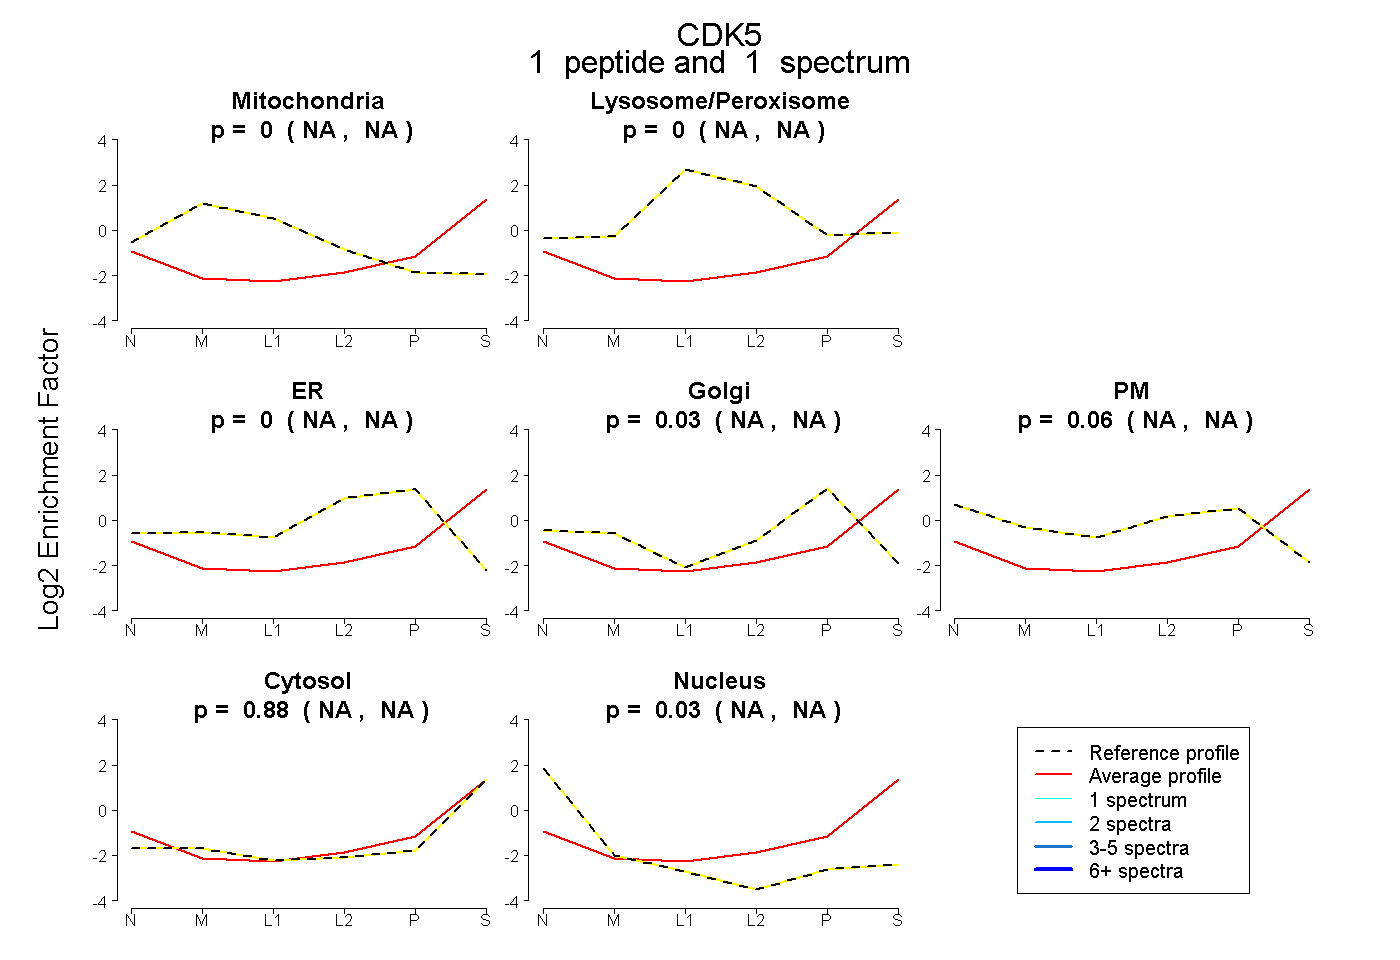
NA | NA
NA | NA
NA | NA
NA | NA
NA | NA
NA | NA
NA | NA
| Plot | Mito | Lyso | Perox | ER | Golgi | PM | Cytosol | Nucleus | |||||
| Expt A |
6 peptides |
11 spectra |
|
0.000 0.000 | 0.000 |
0.000 0.000 | 0.000 |
0.000 0.000 | 0.000 |
0.116 0.072 | 0.147 |
0.000 0.000 | 0.021 |
0.199 0.150 | 0.238 |
0.684 0.668 | 0.697 |
0.000 0.000 | 0.000 |
||
| Plot | Mito | Lyso or Perox | ER | Golgi | PM | Cytosol | Nucleus | ||||||
| Expt B |
1 peptide |
1 spectrum |
|
0.000 NA | NA |
0.000 NA | NA |
0.000 NA | NA |
0.030 NA | NA |
0.061 NA | NA |
0.880 NA | NA |
0.029 NA | NA |
| 1 spectrum, AFGIPVR | 0.000 | 0.000 | 0.000 | 0.030 | 0.061 | 0.880 | 0.029 |
| Plot | Lyso | Other | |||||||||||
| Expt C |
4 peptides |
9 spectra |
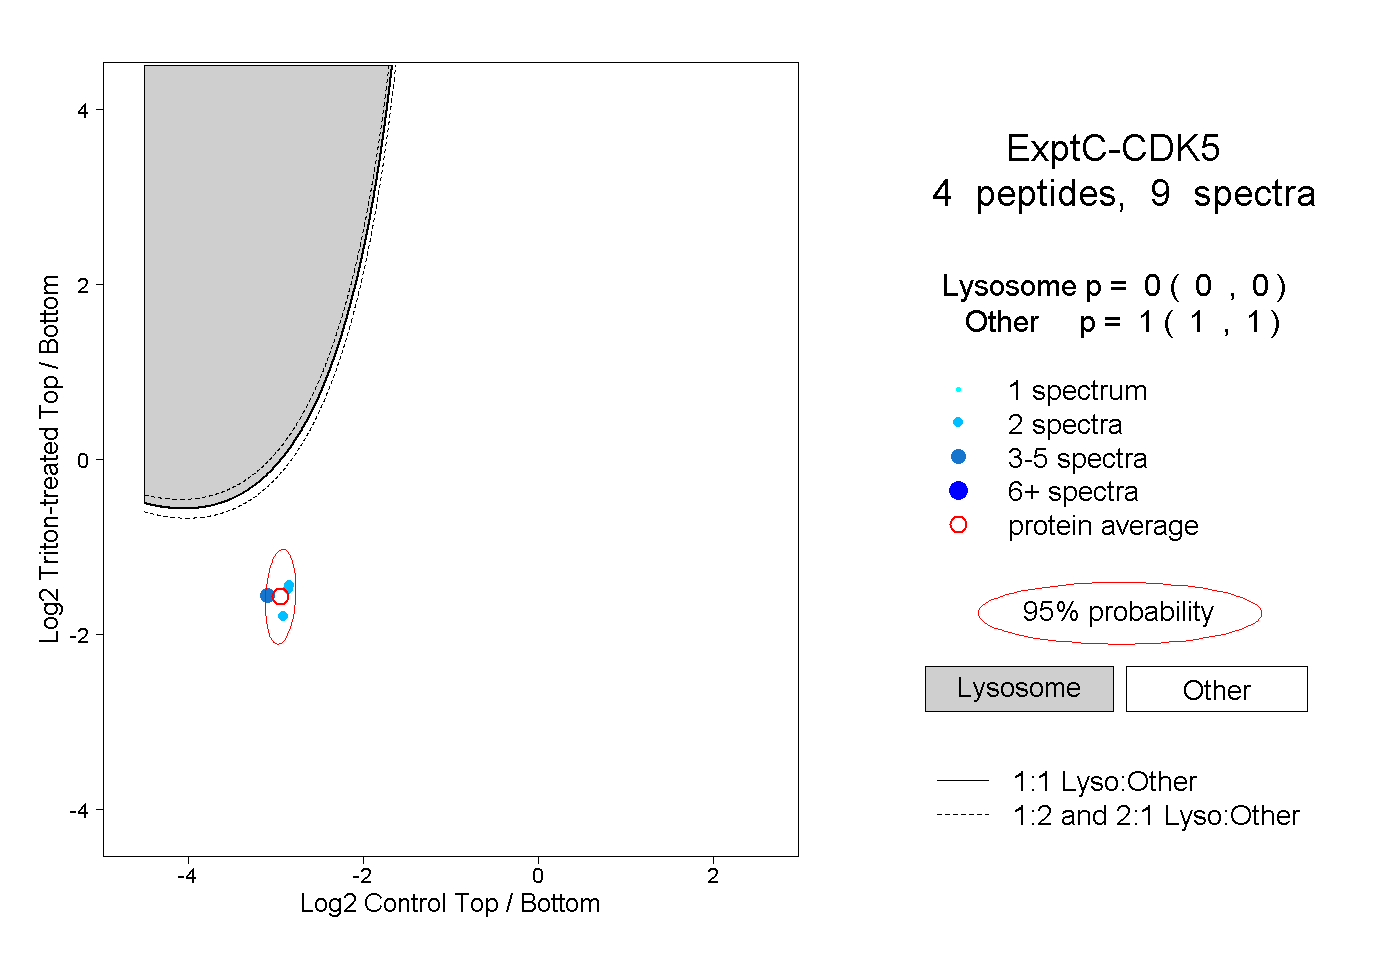 |
0.000 0.000 | 0.000 |
1.000 1.000 | 1.000 |