 5
5peptides
spectra
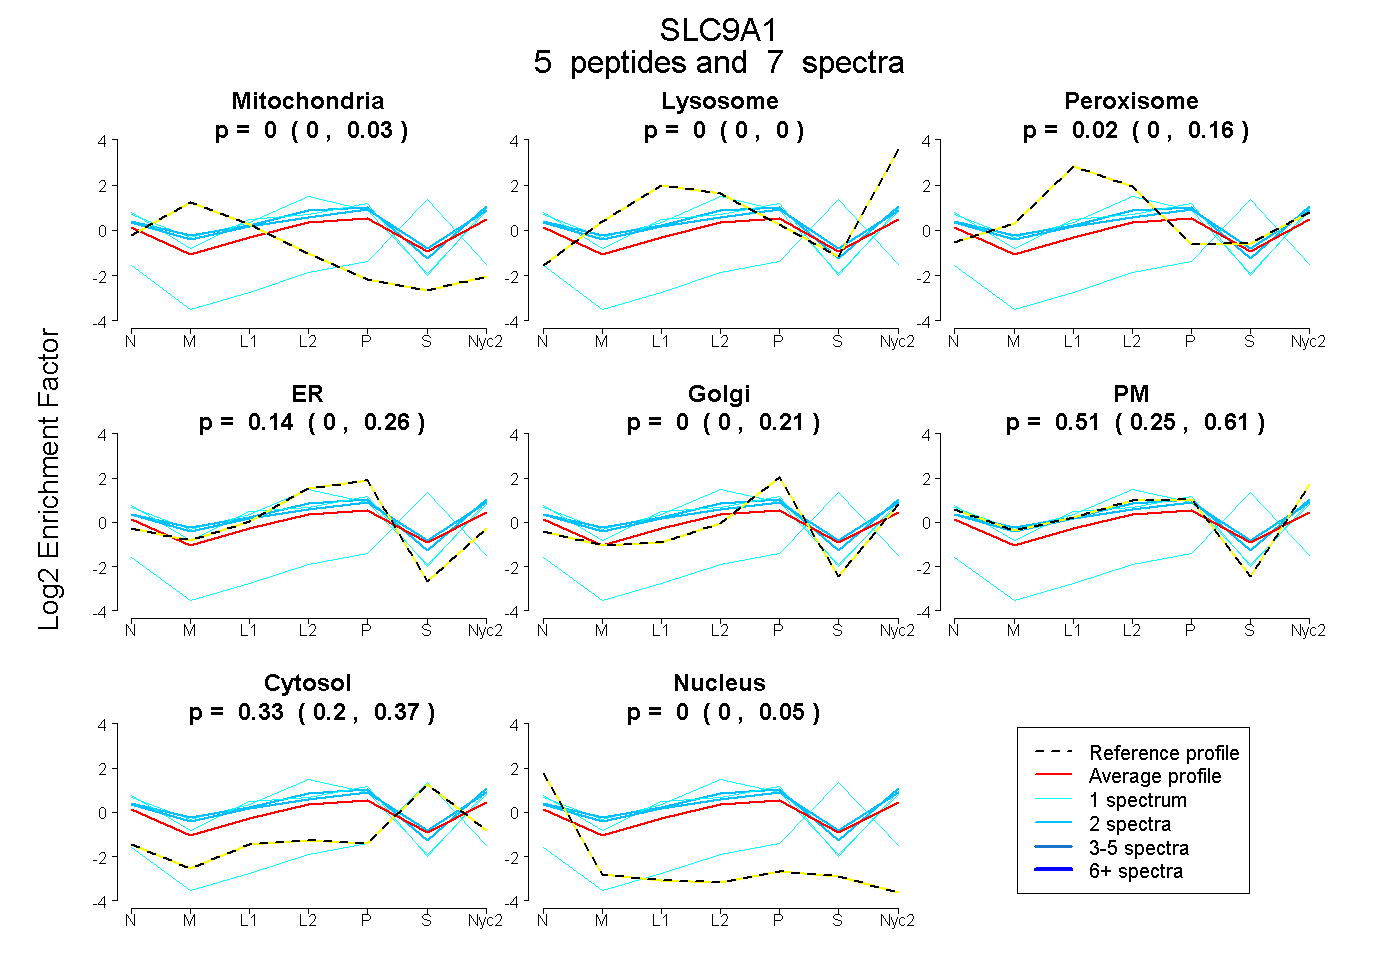
0.000 | 0.033
0.000 | 0.000
0.000 | 0.164
0.000 | 0.259
0.000 | 0.213
0.252 | 0.613
0.199 | 0.368
0.000 | 0.055
| Plot | Mito | Lyso | Perox | ER | Golgi | PM | Cytosol | Nucleus | |||||
| Expt A |
5 peptides |
7 spectra |
|
0.000 0.000 | 0.033 |
0.000 0.000 | 0.000 |
0.024 0.000 | 0.164 |
0.137 0.000 | 0.259 |
0.000 0.000 | 0.213 |
0.510 0.252 | 0.613 |
0.329 0.199 | 0.368 |
0.000 0.000 | 0.055 |
| 1 spectrum, VLGLK | 0.000 | 0.000 | 0.000 | 0.000 | 0.000 | 0.000 | 0.895 | 0.105 | ||
| 2 spectra, ITNYLTVPAHK | 0.000 | 0.000 | 0.172 | 0.023 | 0.115 | 0.591 | 0.098 | 0.000 | ||
| 1 spectrum, CLIAGER | 0.000 | 0.000 | 0.175 | 0.222 | 0.000 | 0.575 | 0.000 | 0.028 | ||
| 2 spectra, QAIELVESGGMGK | 0.000 | 0.000 | 0.179 | 0.000 | 0.121 | 0.520 | 0.180 | 0.000 | ||
| 1 spectrum, LDSPTMSR | 0.000 | 0.000 | 0.093 | 0.124 | 0.056 | 0.665 | 0.018 | 0.045 |
| Plot | Lyso | Other | |||||||||||
| Expt C |
2 peptides |
5 spectra |
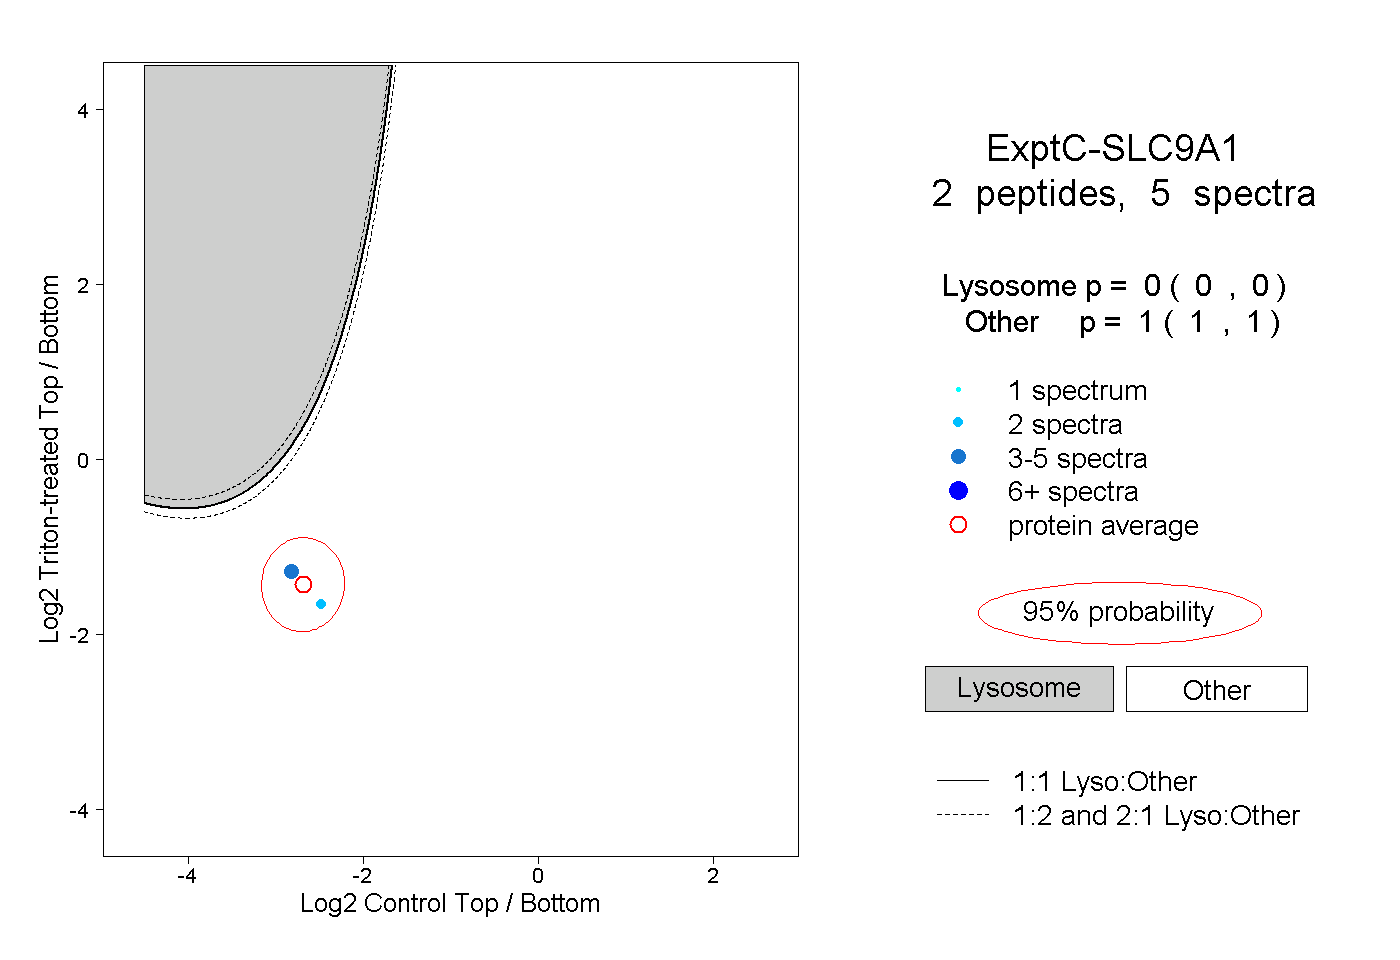 |
0.000 0.000 | 0.000 |
1.000 1.000 | 1.000 |