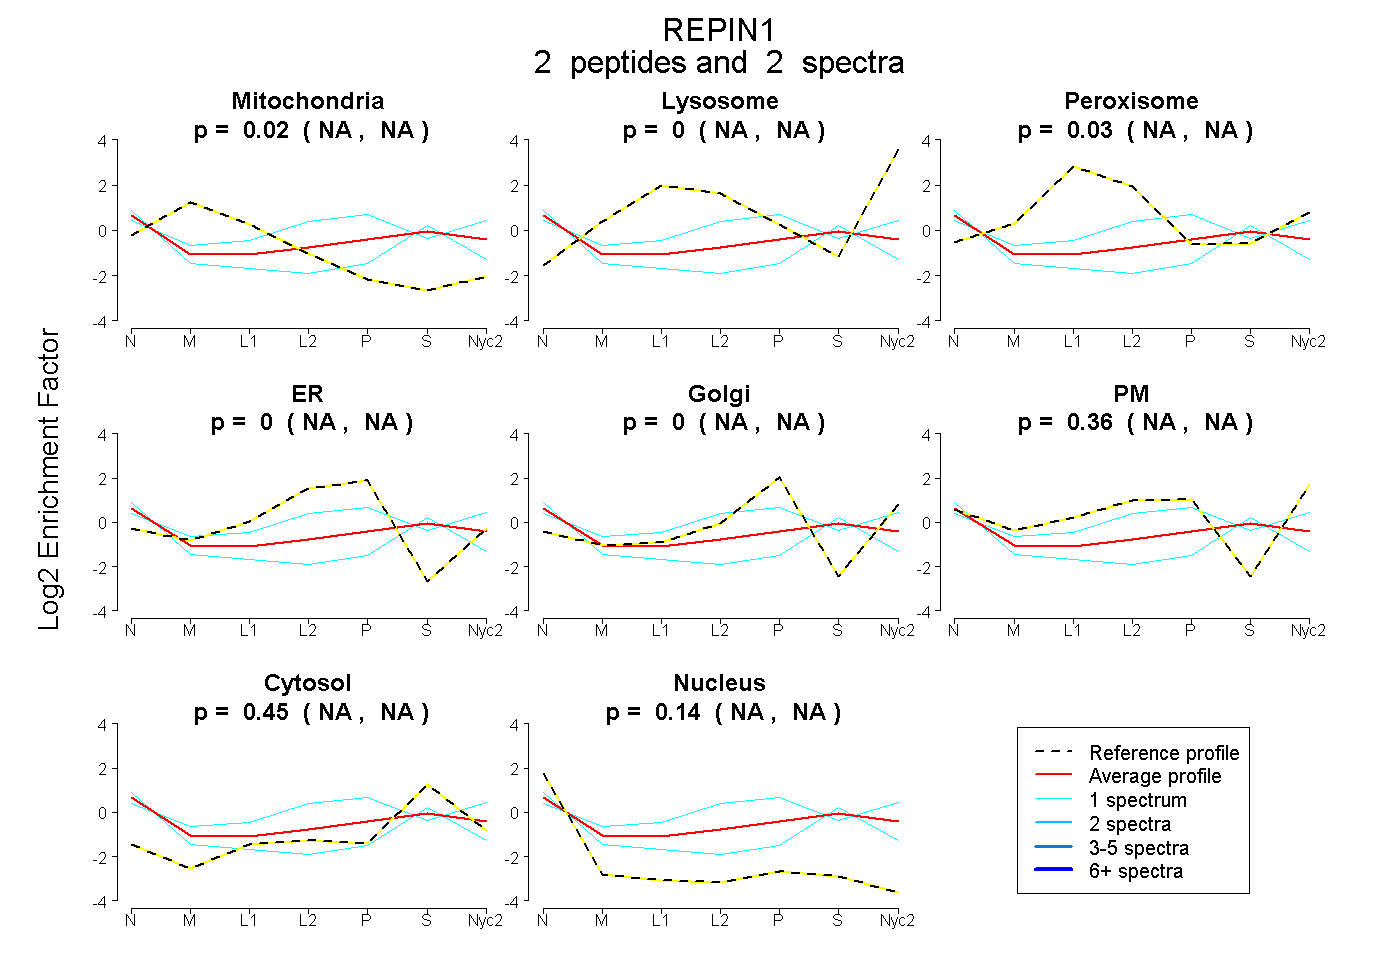
 2
2peptides
spectra
NA | NA
NA | NA
NA | NA
NA | NA
NA | NA
NA | NA
NA | NA
NA | NA
| Plot | Mito | Lyso | Perox | ER | Golgi | PM | Cytosol | Nucleus | |||||
| Expt A |
2 peptides |
2 spectra |
|
0.016 NA | NA |
0.000 NA | NA |
0.032 NA | NA |
0.000 NA | NA |
0.000 NA | NA |
0.361 NA | NA |
0.447 NA | NA |
0.144 NA | NA |
| 1 spectrum, VHVAEALEEAAAK | 0.000 | 0.000 | 0.043 | 0.074 | 0.000 | 0.541 | 0.343 | 0.000 | ||
| 1 spectrum, ALGPRPR | 0.050 | 0.000 | 0.029 | 0.000 | 0.000 | 0.096 | 0.519 | 0.306 |
| Plot | Lyso | Other | |||||||||||
| Expt C |
1 peptide |
2 spectra |
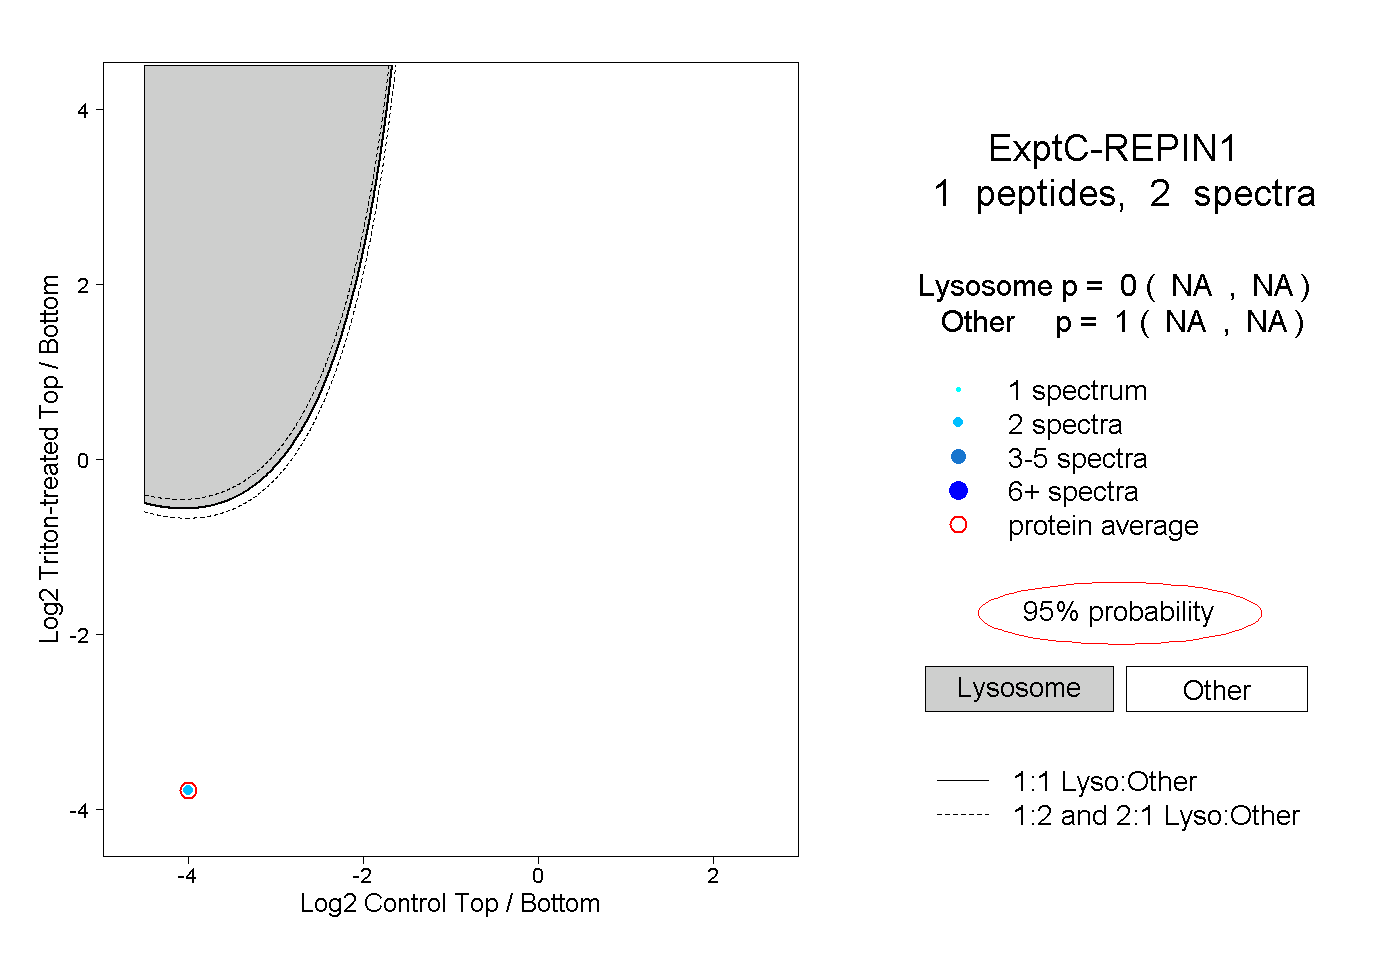 |
0.000 NA | NA |
1.000 NA | NA |