 6
6peptides
spectra
0.000 | 0.000
0.000 | 0.000
0.108 | 0.148
0.007 | 0.097
0.023 | 0.110
0.278 | 0.342
0.417 | 0.445
0.000 | 0.000
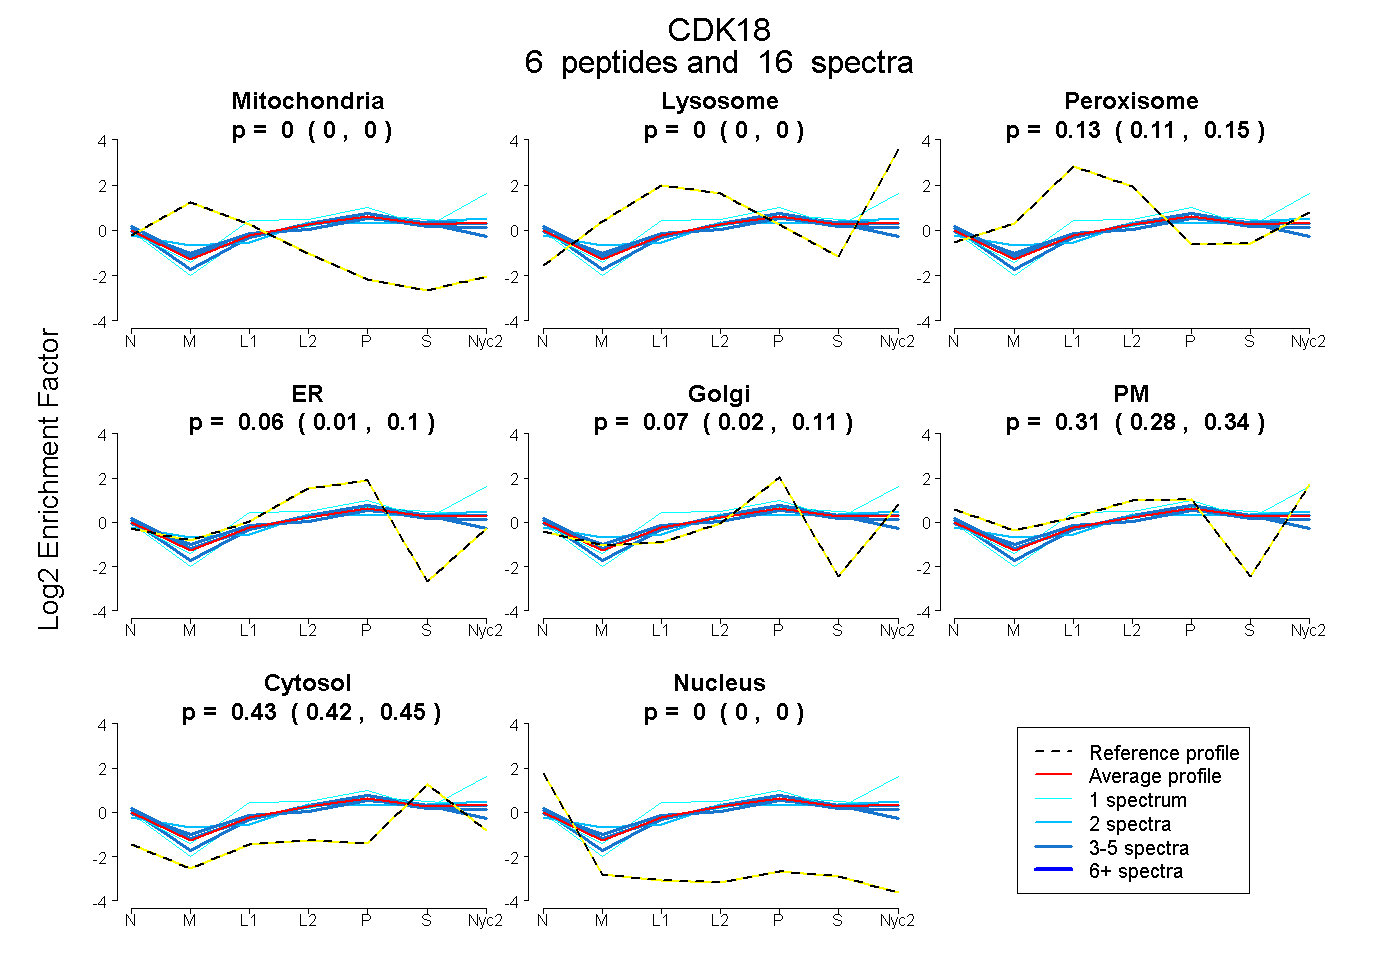
| Plot | Mito | Lyso | Perox | ER | Golgi | PM | Cytosol | Nucleus | |||||
| Expt A |
6 peptides |
16 spectra |
|
0.000 0.000 | 0.000 |
0.000 0.000 | 0.000 |
0.130 0.108 | 0.148 |
0.058 0.007 | 0.097 |
0.069 0.023 | 0.110 |
0.311 0.278 | 0.342 |
0.433 0.417 | 0.445 |
0.000 0.000 | 0.000 |
| 4 spectra, YLPQPLLSHAPR | 0.000 | 0.000 | 0.198 | 0.000 | 0.159 | 0.225 | 0.418 | 0.000 | ||
| 5 spectra, LEHEEGAPCTAIR | 0.000 | 0.000 | 0.091 | 0.137 | 0.000 | 0.333 | 0.439 | 0.000 | ||
| 2 spectra, HANIVTLHDLIHTDR | 0.000 | 0.034 | 0.128 | 0.000 | 0.020 | 0.373 | 0.445 | 0.000 | ||
| 3 spectra, EELHLIFR | 0.000 | 0.000 | 0.069 | 0.313 | 0.000 | 0.137 | 0.481 | 0.000 | ||
| 1 spectrum, GLAFQHPGR | 0.000 | 0.279 | 0.000 | 0.000 | 0.026 | 0.361 | 0.334 | 0.000 | ||
| 1 spectrum, DLKPQNLLINER | 0.000 | 0.000 | 0.092 | 0.101 | 0.032 | 0.282 | 0.492 | 0.000 |
| Plot | Mito | Lyso or Perox | ER | Golgi | PM | Cytosol | Nucleus | ||||||
| Expt B |
1 peptide |
1 spectrum |
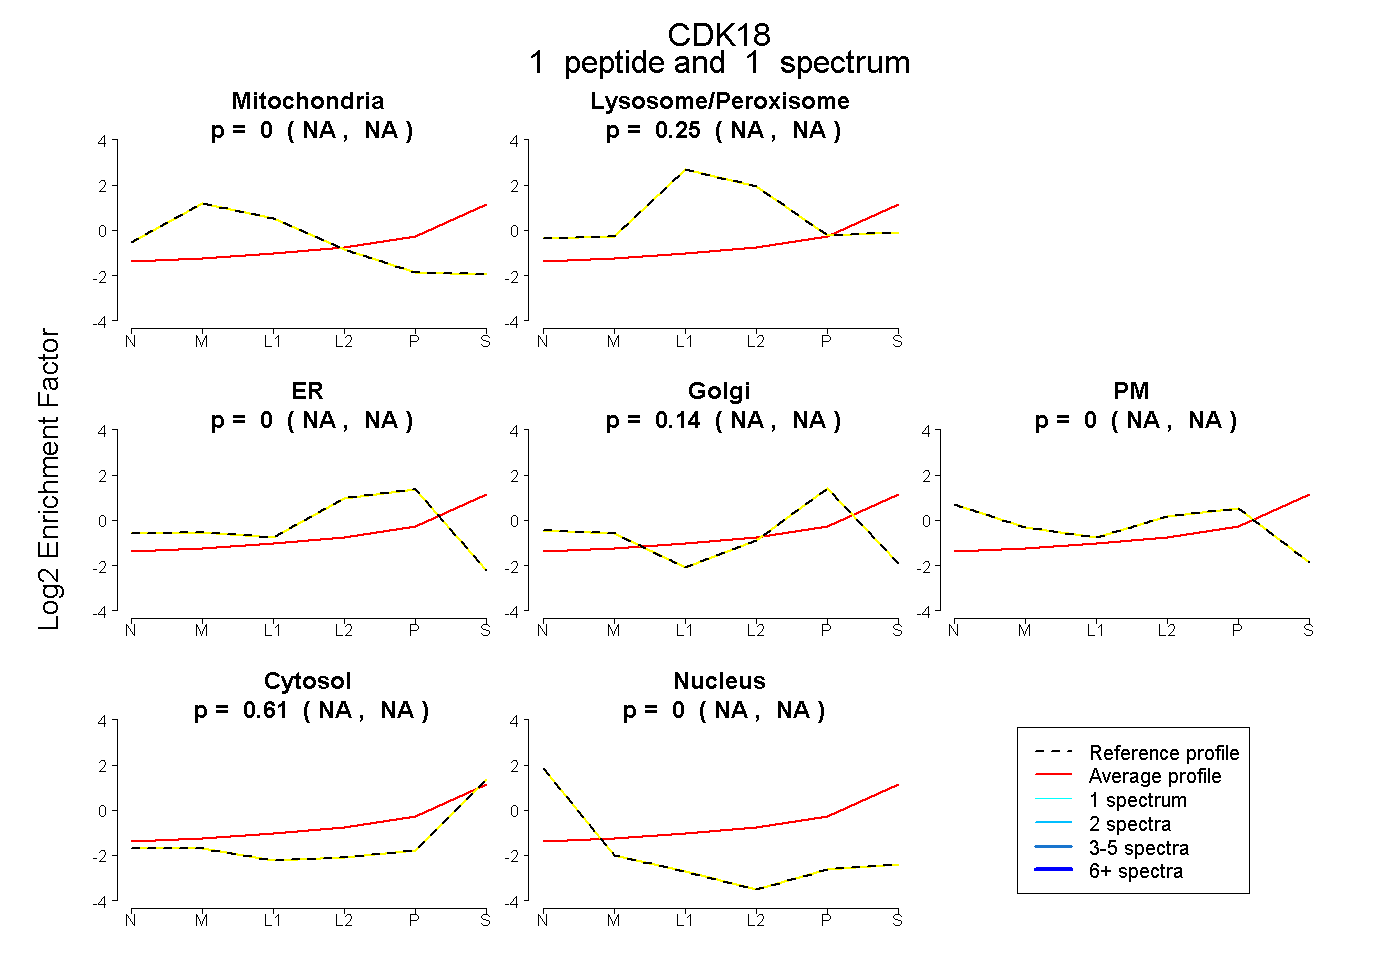 |
0.000 NA | NA |
0.254 NA | NA |
0.000 NA | NA |
0.140 NA | NA |
0.000 NA | NA |
0.606 NA | NA |
0.000 NA | NA |
|||
| Plot | Lyso | Other | |||||||||||
| Expt C |
6 peptides |
12 spectra |
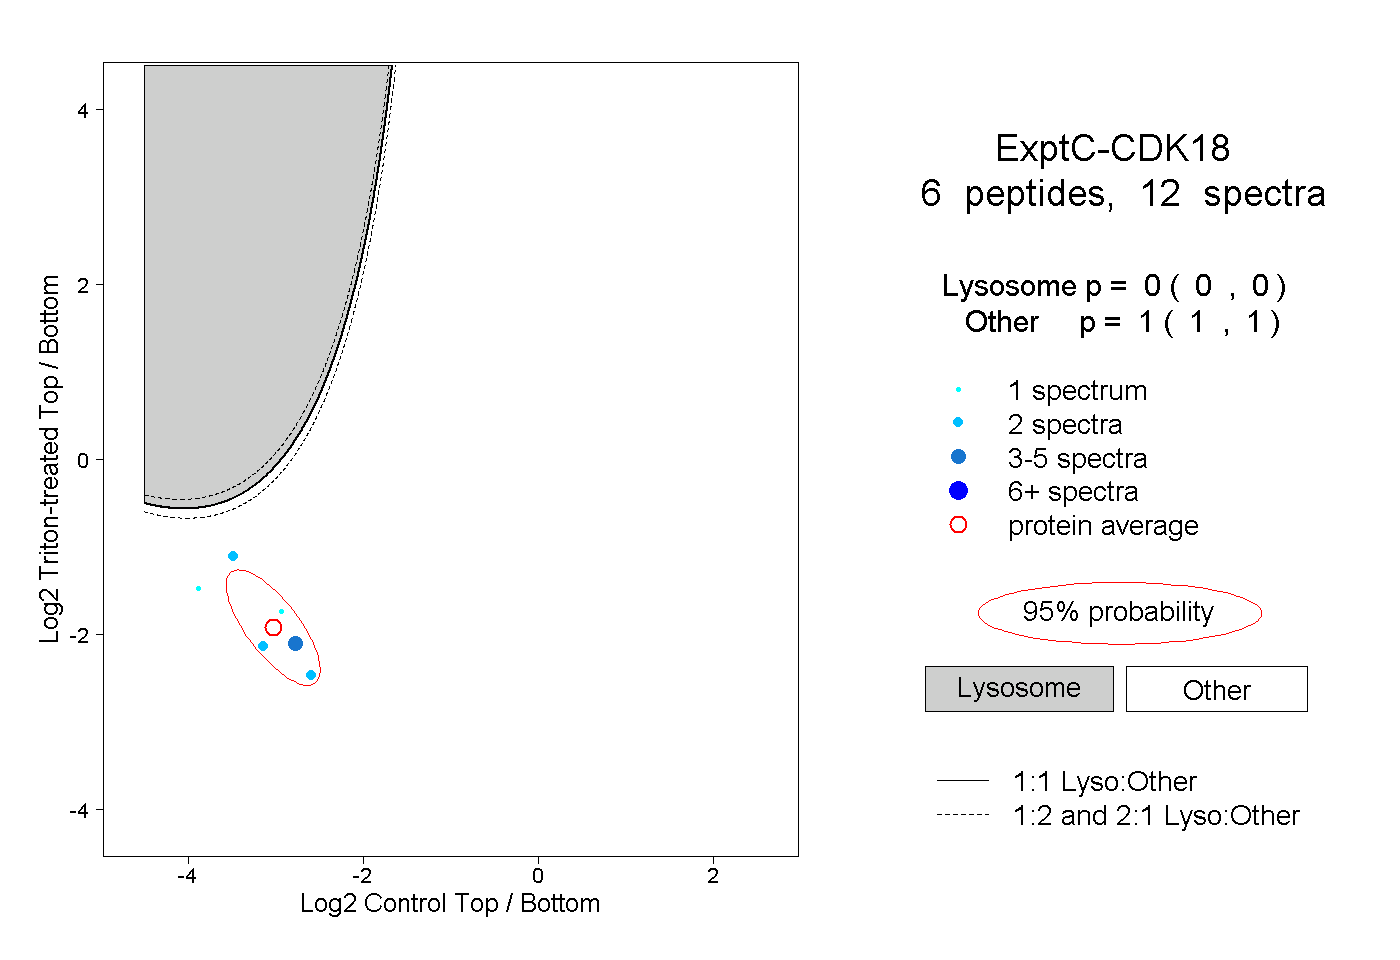 |
0.000 0.000 | 0.000 |
1.000 1.000 | 1.000 |