CUL5
[ENSRNOP00000010956]
Main page
| | | Plot |
Mito |
Lyso |
|
Perox |
ER |
Golgi |
PM |
Cytosol |
Nucleus |
|
| Expt A |
 9
9
peptides |
16
spectra |
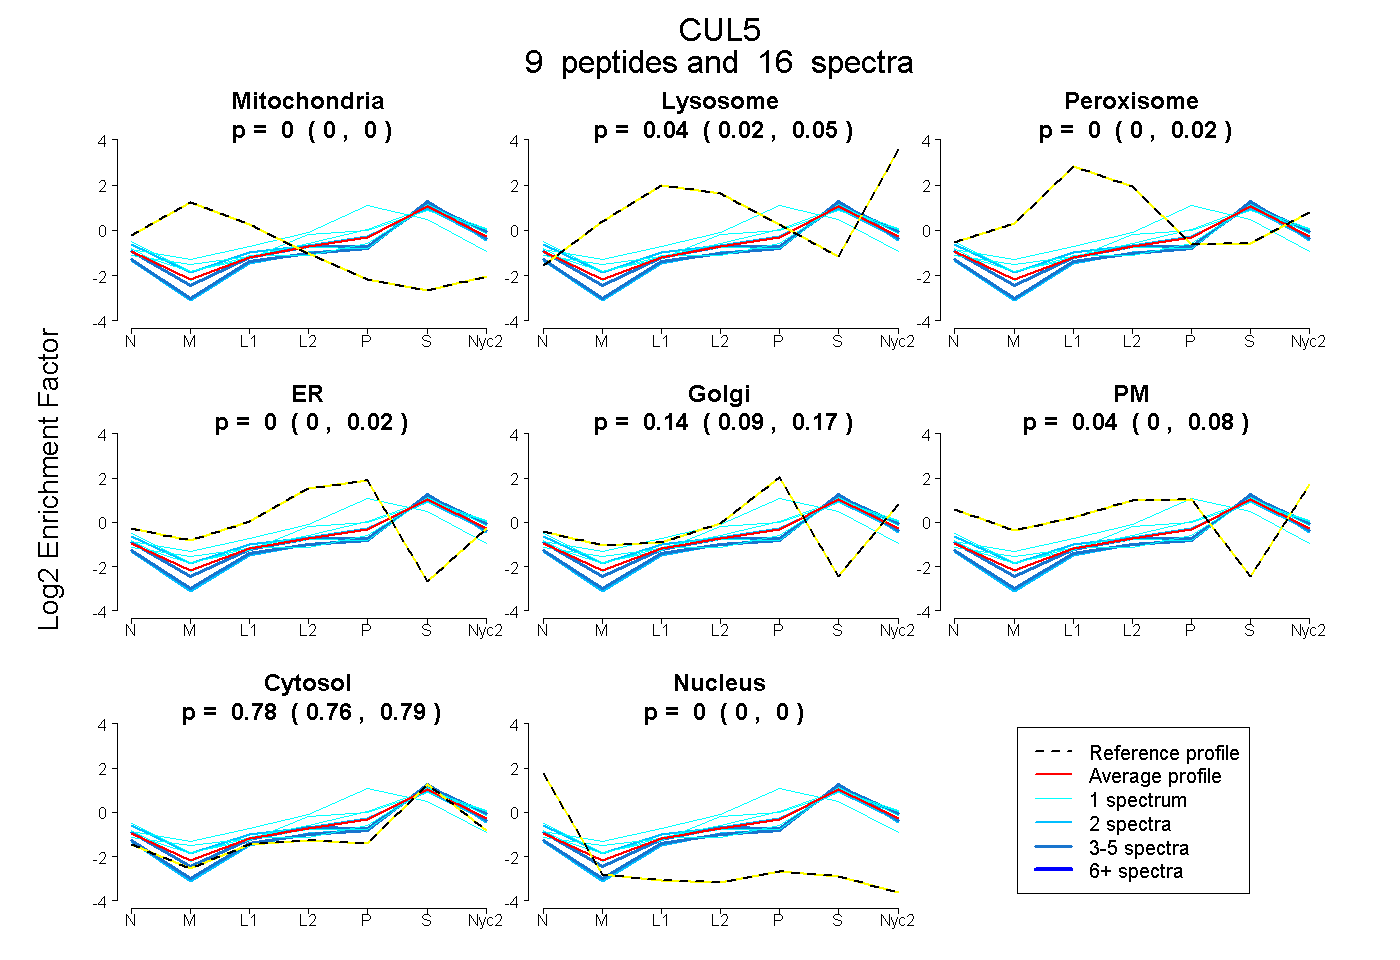 |
0.000
0.000 | 0.000 |
0.036
0.020 | 0.048 |
|
0.003
0.000 | 0.018 |
0.002
0.000 | 0.021 |
0.138
0.089 | 0.174 |
0.039
0.000 | 0.076 |
0.780
0.763 | 0.794 |
0.000
0.000 | 0.000 |
|
| | | Plot |
Mito |
|
Lyso or Perox |
|
ER |
Golgi |
PM |
Cytosol |
Nucleus |
|
| Expt B |
3
peptides |
5
spectra |
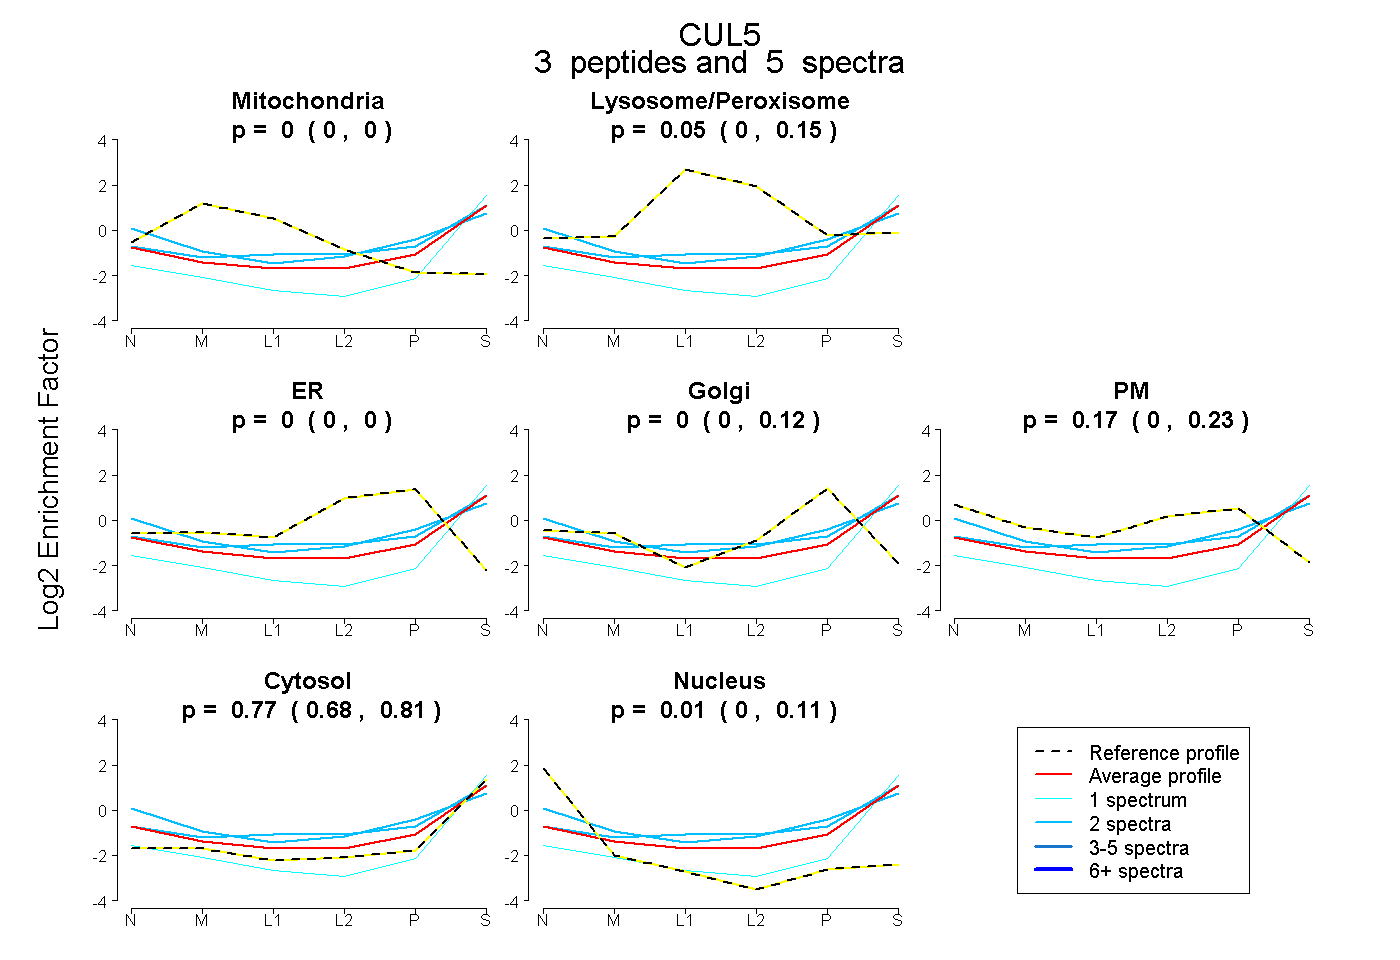 |
0.000
0.000 | 0.000 |
|
0.050
0.000 | 0.152 |
|
0.000
0.000 | 0.000 |
0.000
0.000 | 0.121 |
0.166
0.000 | 0.232 |
0.768
0.680 | 0.812 |
0.015
0.000 | 0.107 |
|
| | | Plot |
|
Lyso |
|
|
|
|
|
|
|
Other |
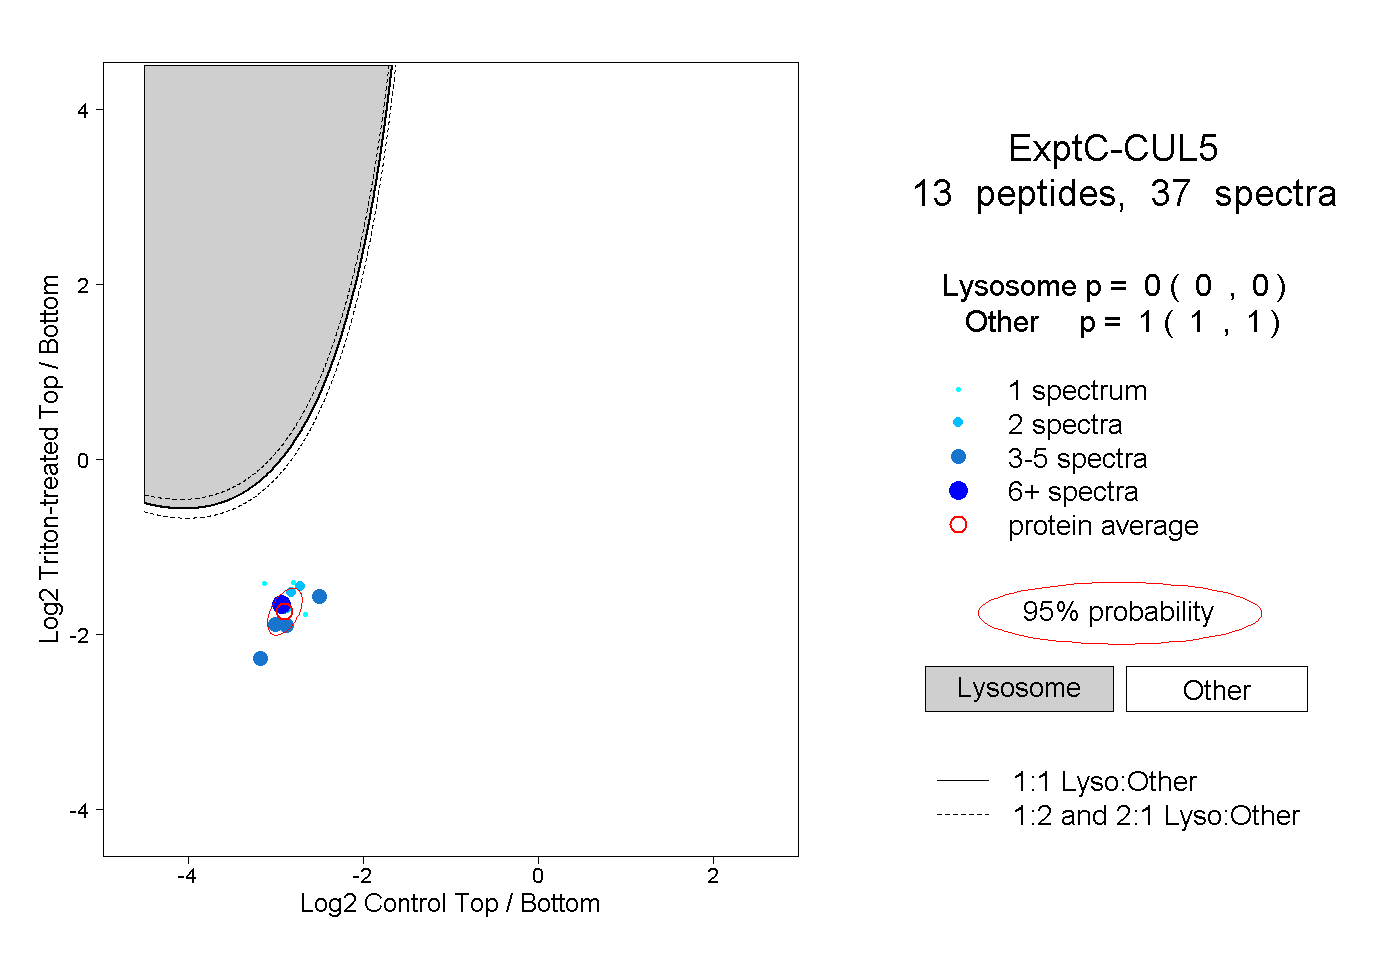
| Expt C |
13
peptides |
37
spectra |
 |
|
0.000
0.000 | 0.000 |
|
|
|
|
|
|
|
1.000
1.000 | 1.000 |
| 2 spectra, SNMEDSIVR |
|
0.000 |
|
|
|
|
|
|
|
1.000 |
| 1 spectrum, ILNAGAWSR |
|
0.000 |
|
|
|
|
|
|
|
1.000 |
| 3 spectra, EQIEWLIEHK |
|
0.000 |
|
|
|
|
|
|
|
1.000 |
| 5 spectra, EAFQDDPR |
|
0.000 |
|
|
|
|
|
|
|
1.000 |
| 9 spectra, TQPESK |
|
0.000 |
|
|
|
|
|
|
|
1.000 |
| 2 spectra, LTSEEIEAK |
|
0.000 |
|
|
|
|
|
|
|
1.000 |
| 1 spectrum, EVGMPADYVNK |
|
0.000 |
|
|
|
|
|
|
|
1.000 |
| 2 spectra, LQLTTER |
|
0.000 |
|
|
|
|
|
|
|
1.000 |
| 3 spectra, AYIVEWR |
|
0.000 |
|
|
|
|
|
|
|
1.000 |
| 2 spectra, AYLDSTER |
|
0.000 |
|
|
|
|
|
|
|
1.000 |
| 3 spectra, ISFENLK |
|
0.000 |
|
|
|
|
|
|
|
1.000 |
| 3 spectra, VLSHQDDTALLK |
|
0.000 |
|
|
|
|
|
|
|
1.000 |
| 1 spectrum, LATELPDAELR |
|
0.000 |
|
|
|
|
|
|
|
1.000 |