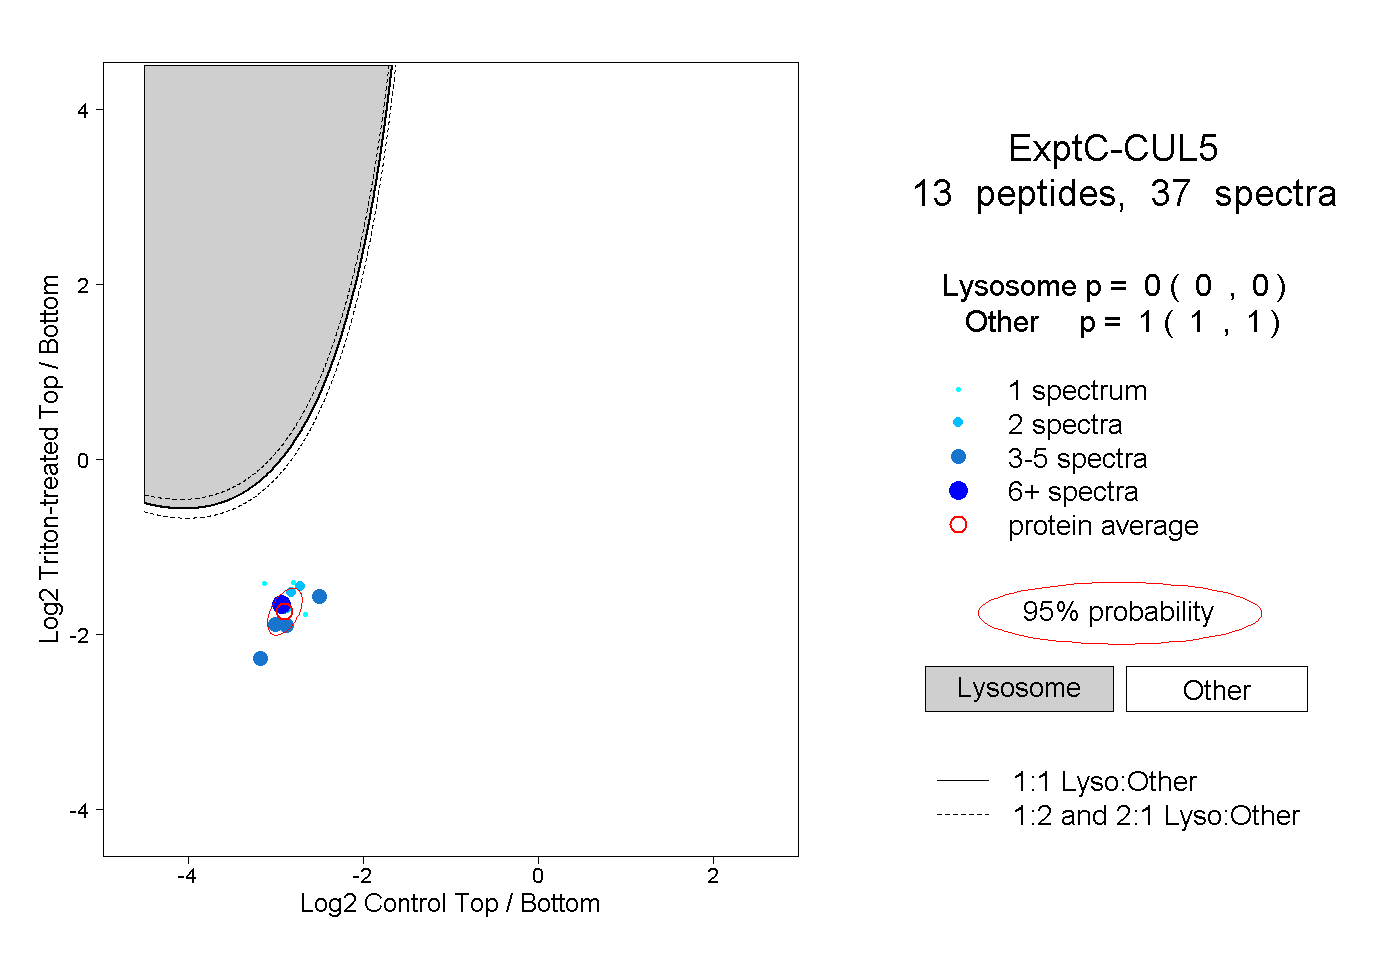
9
9peptides
spectra
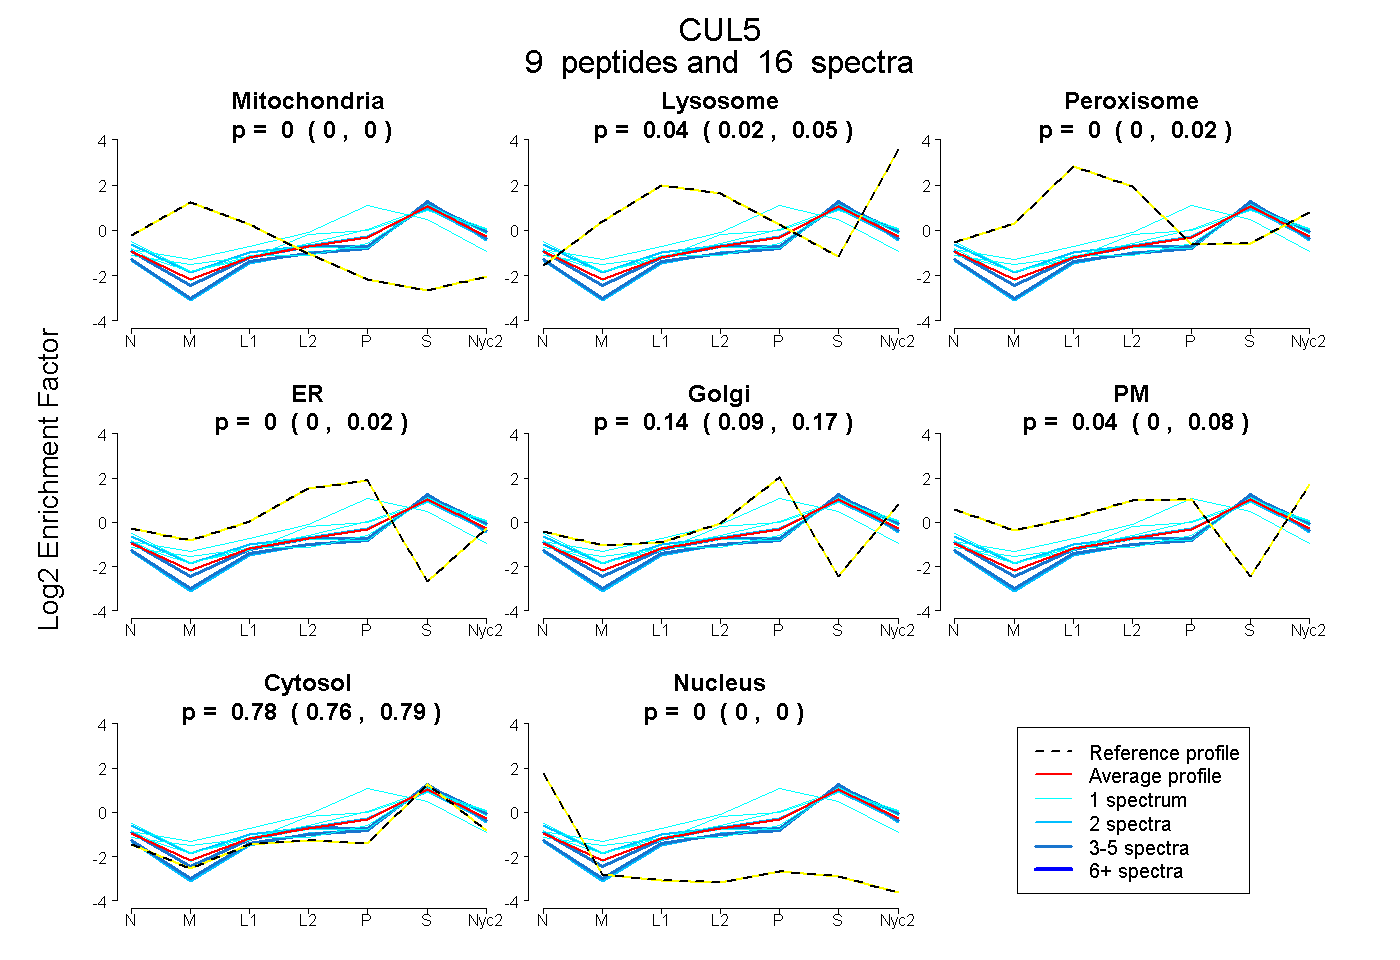
0.000 | 0.000
0.020 | 0.048
0.000 | 0.018
0.000 | 0.021
0.089 | 0.174
0.000 | 0.076
0.763 | 0.794
0.000 | 0.000
3peptides
spectra
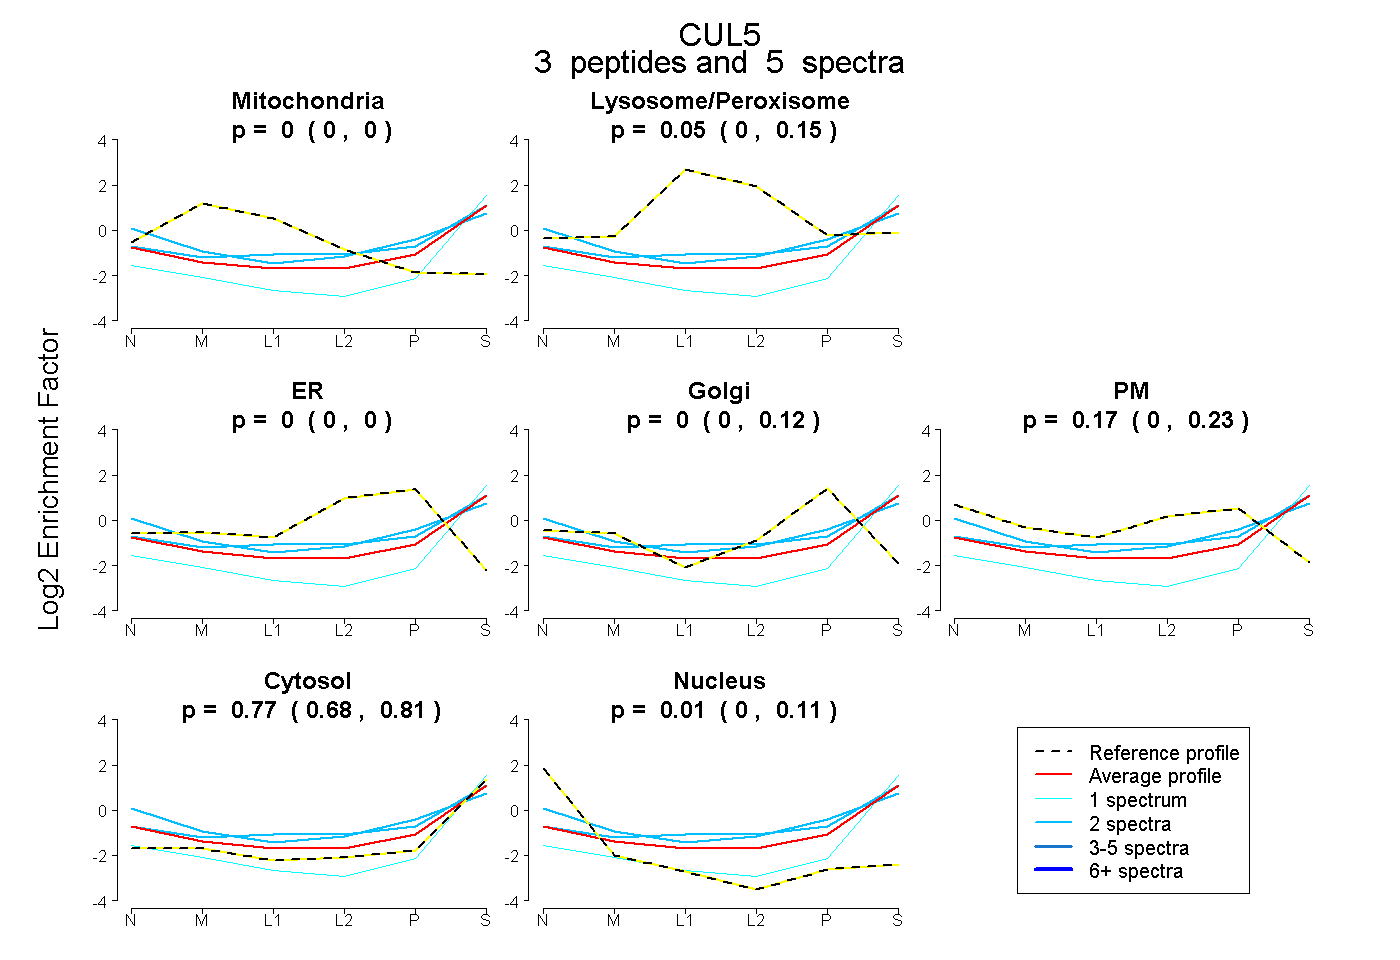
0.000 | 0.000
0.000 | 0.152
0.000 | 0.000
0.000 | 0.121
0.000 | 0.232
0.680 | 0.812
0.000 | 0.107