 9
9peptides
spectra
0.000 | 0.000
0.020 | 0.048
0.000 | 0.018
0.000 | 0.021
0.089 | 0.174
0.000 | 0.076
0.763 | 0.794
0.000 | 0.000
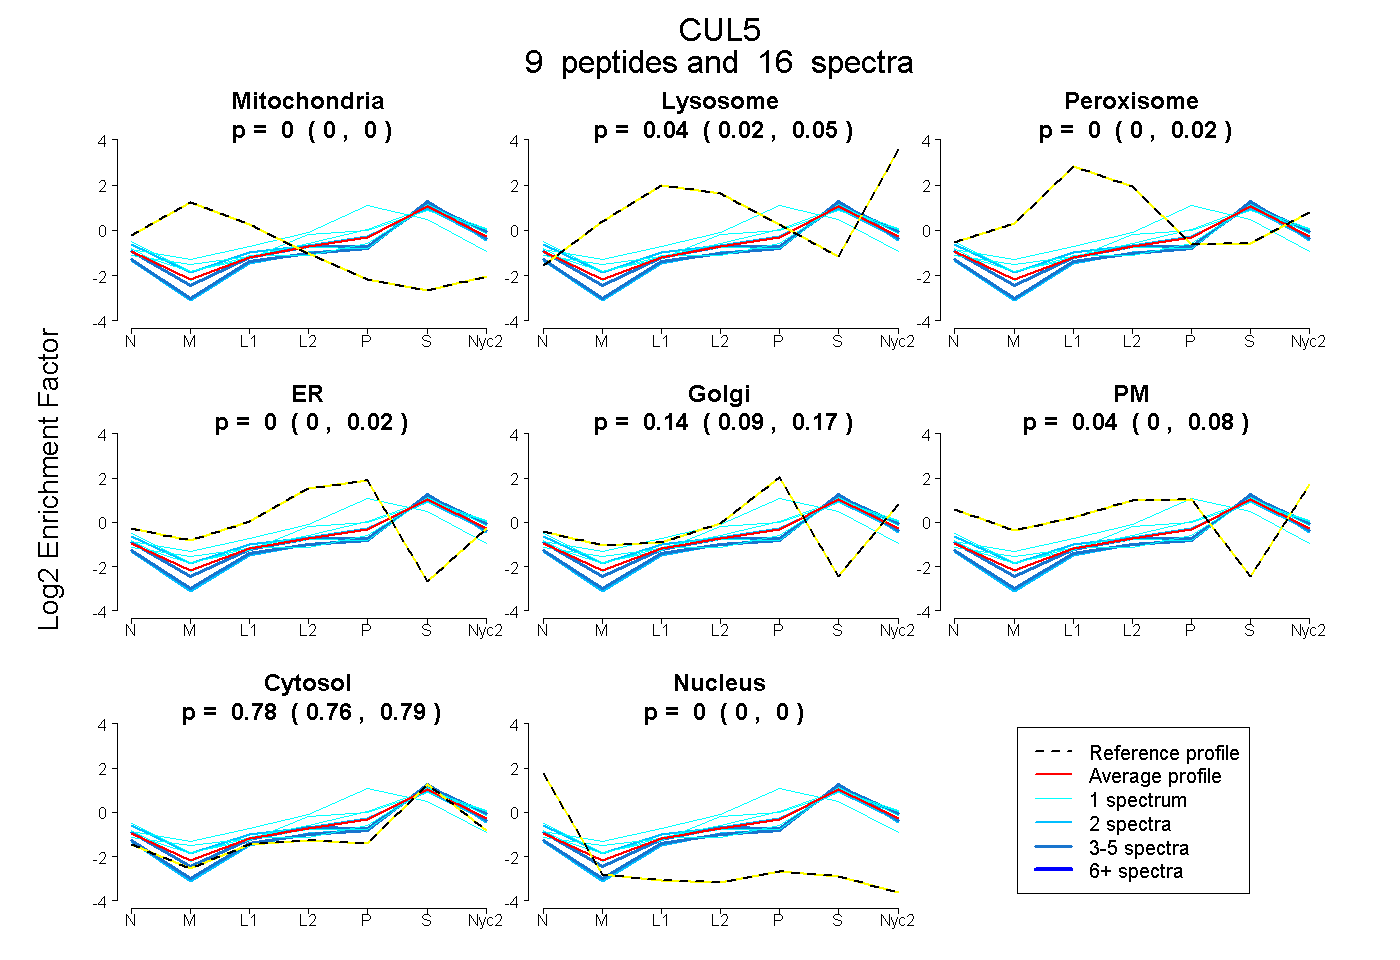
| Plot | Mito | Lyso | Perox | ER | Golgi | PM | Cytosol | Nucleus | |||||
| Expt A |
9 peptides |
16 spectra |
|
0.000 0.000 | 0.000 |
0.036 0.020 | 0.048 |
0.003 0.000 | 0.018 |
0.002 0.000 | 0.021 |
0.138 0.089 | 0.174 |
0.039 0.000 | 0.076 |
0.780 0.763 | 0.794 |
0.000 0.000 | 0.000 |
| 1 spectrum, SNMEDSIVR | 0.000 | 0.000 | 0.000 | 0.010 | 0.031 | 0.274 | 0.685 | 0.000 | ||
| 3 spectra, EQIEWLIEHK | 0.000 | 0.009 | 0.000 | 0.000 | 0.069 | 0.000 | 0.922 | 0.000 | ||
| 4 spectra, EAFQDDPR | 0.000 | 0.042 | 0.000 | 0.000 | 0.000 | 0.119 | 0.839 | 0.000 | ||
| 1 spectrum, LTSEEIEAK | 0.000 | 0.100 | 0.000 | 0.000 | 0.203 | 0.000 | 0.697 | 0.000 | ||
| 1 spectrum, TLWSLVAFPK | 0.000 | 0.118 | 0.000 | 0.000 | 0.000 | 0.074 | 0.808 | 0.000 | ||
| 1 spectrum, LQLTTER | 0.000 | 0.001 | 0.000 | 0.000 | 0.037 | 0.126 | 0.836 | 0.000 | ||
| 2 spectra, DFTEGTLFSVNQDFSLIK | 0.000 | 0.000 | 0.051 | 0.007 | 0.087 | 0.123 | 0.732 | 0.000 | ||
| 2 spectra, AYLDSTER | 0.000 | 0.000 | 0.000 | 0.000 | 0.067 | 0.000 | 0.933 | 0.000 | ||
| 1 spectrum, ETILAECQGMIK | 0.000 | 0.000 | 0.000 | 0.448 | 0.000 | 0.000 | 0.552 | 0.000 |
| Plot | Mito | Lyso or Perox | ER | Golgi | PM | Cytosol | Nucleus | ||||||
| Expt B |
3 peptides |
5 spectra |
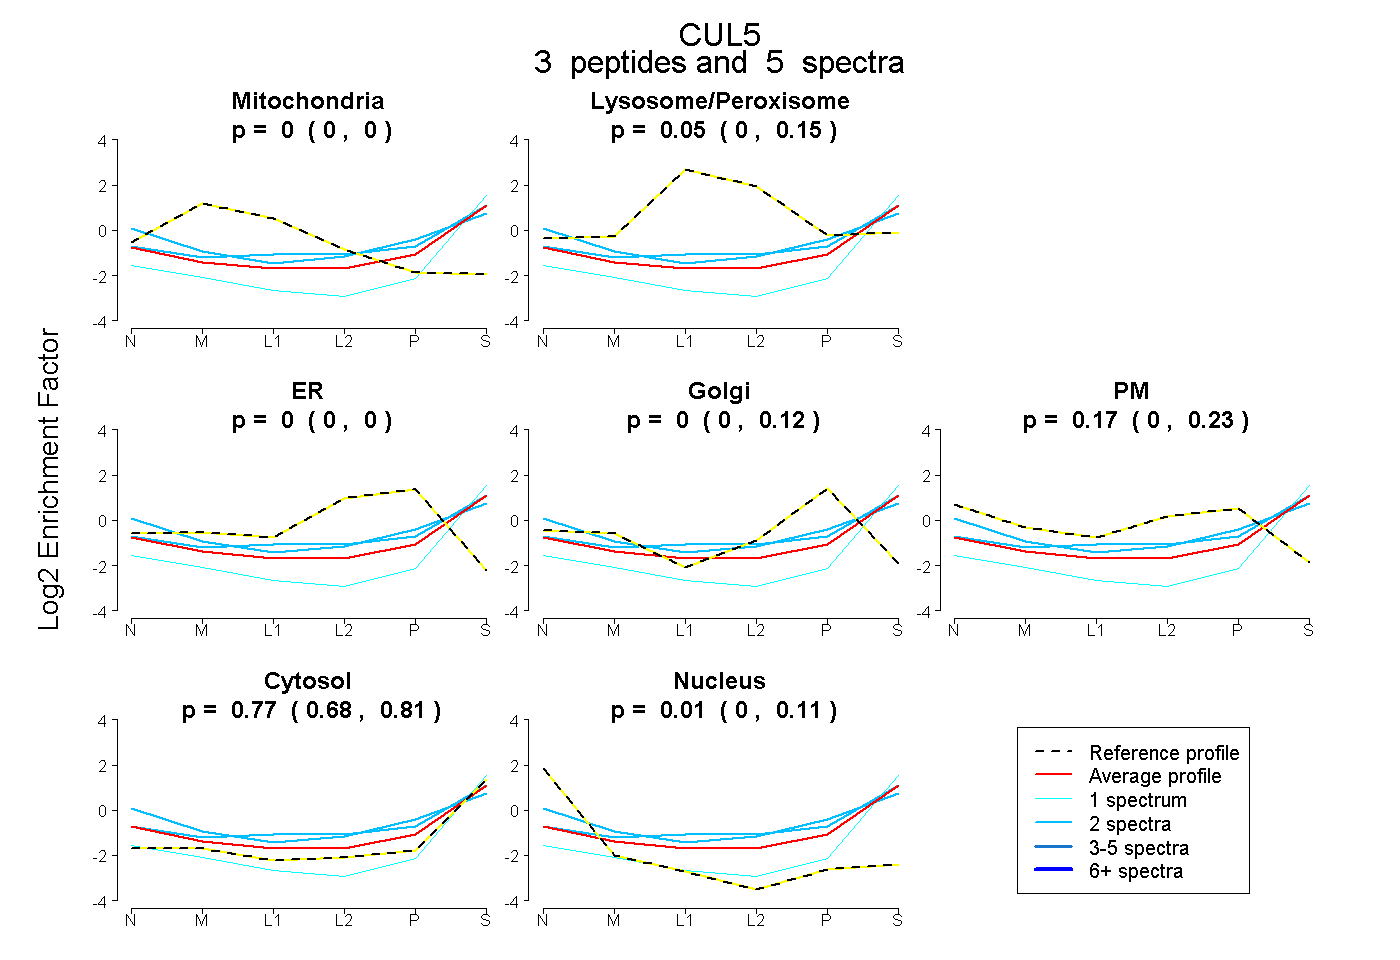 |
0.000 0.000 | 0.000 |
0.050 0.000 | 0.152 |
0.000 0.000 | 0.000 |
0.000 0.000 | 0.121 |
0.166 0.000 | 0.232 |
0.768 0.680 | 0.812 |
0.015 0.000 | 0.107 |
|||
| Plot | Lyso | Other | |||||||||||
| Expt C |
13 peptides |
37 spectra |
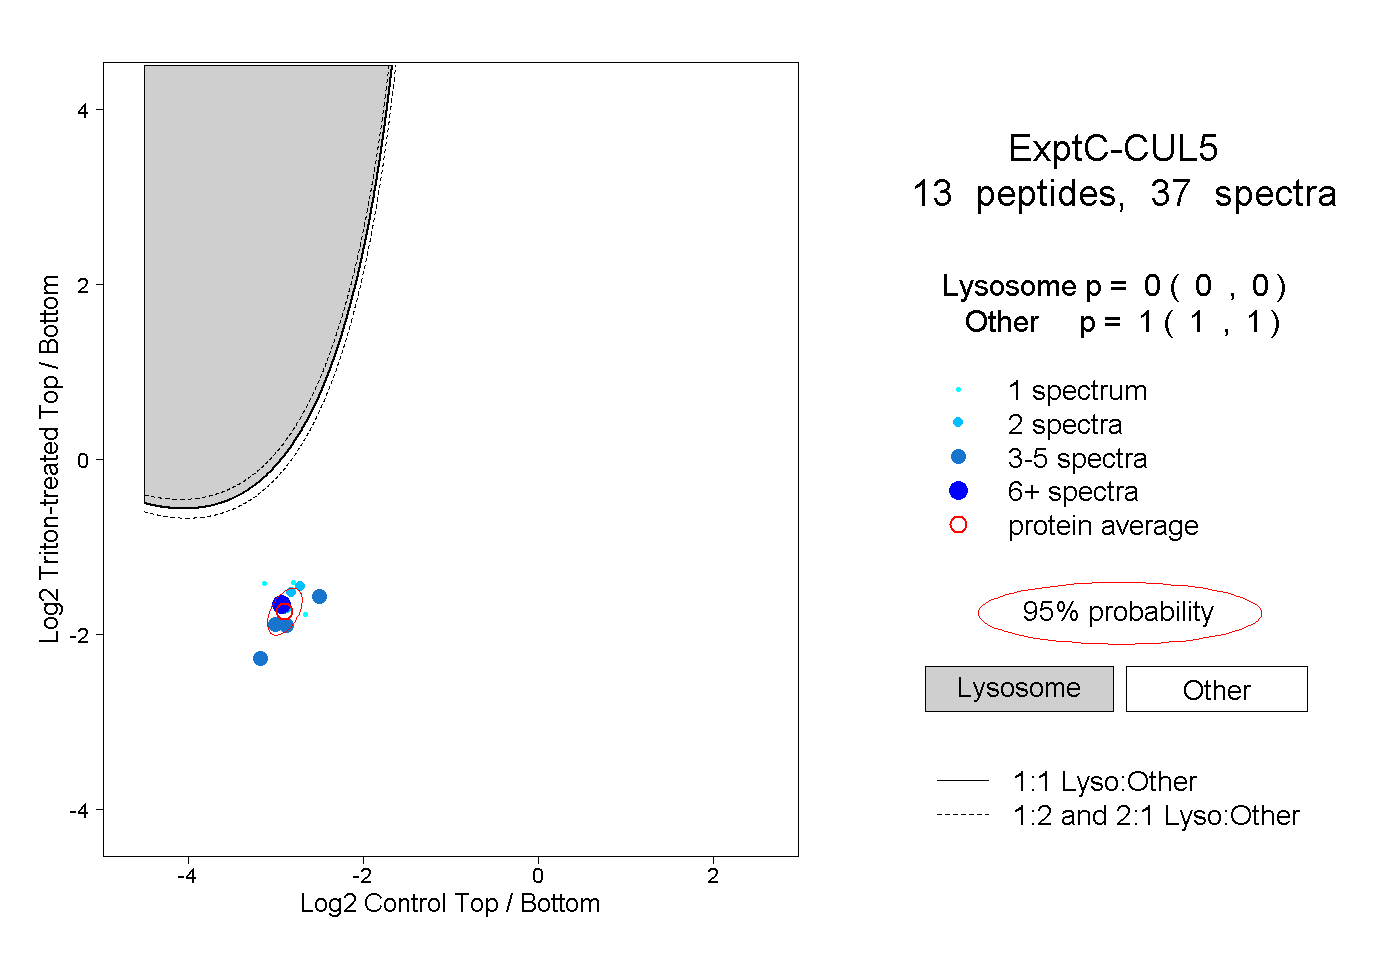 |
0.000 0.000 | 0.000 |
1.000 1.000 | 1.000 |