20
20peptides
spectra
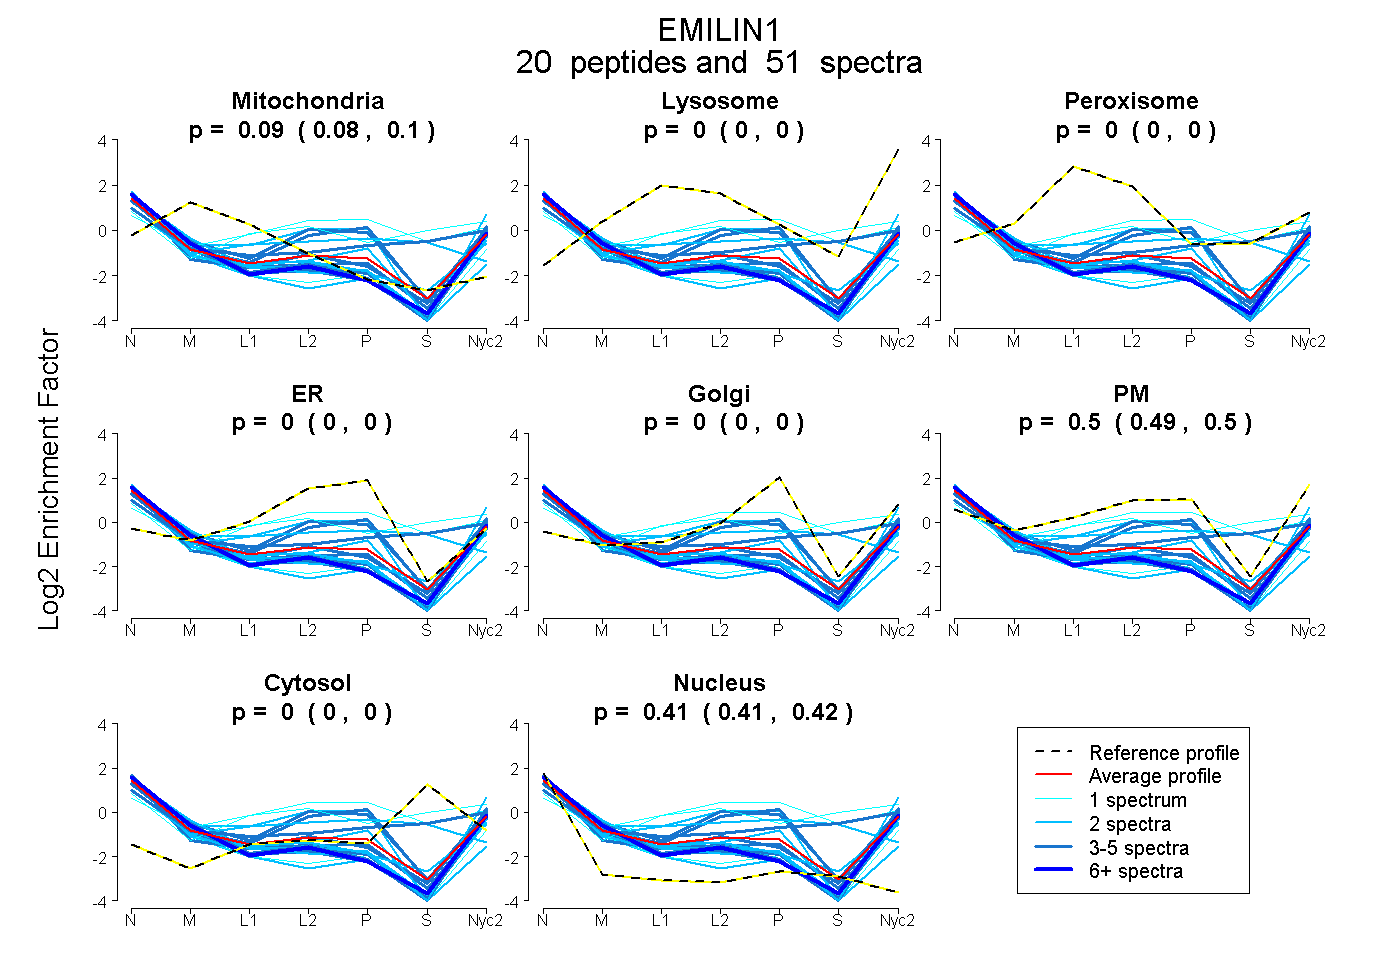
0.083 | 0.097
0.000 | 0.000
0.000 | 0.000
0.000 | 0.000
0.000 | 0.000
0.490 | 0.504
0.000 | 0.000
0.408 | 0.416
6peptides
spectra
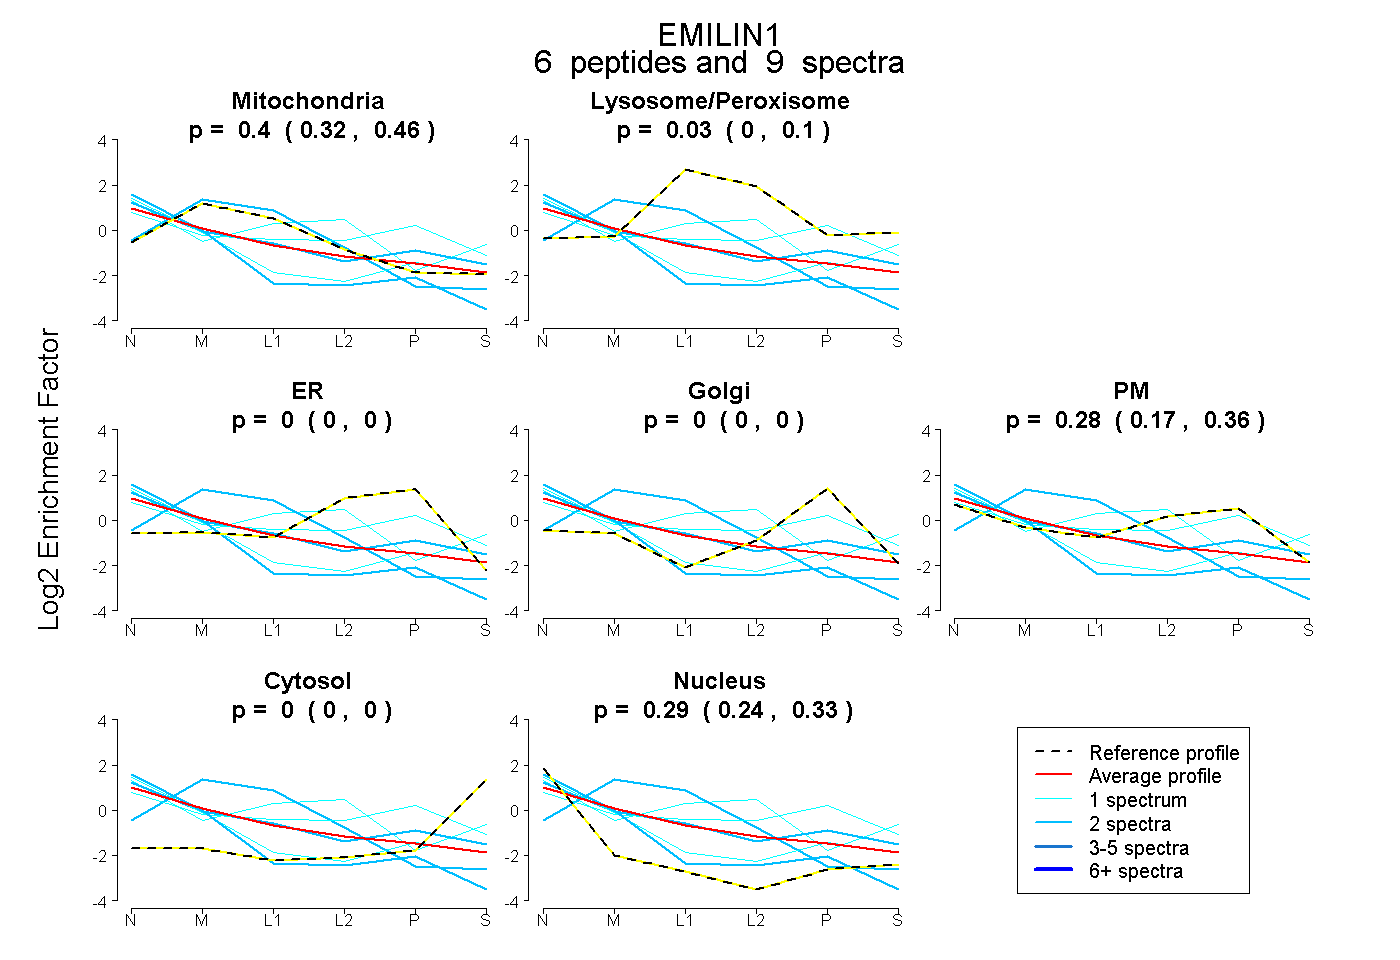
0.324 | 0.456
0.000 | 0.102
0.000 | 0.000
0.000 | 0.000
0.168 | 0.357
0.000 | 0.000
0.240 | 0.335
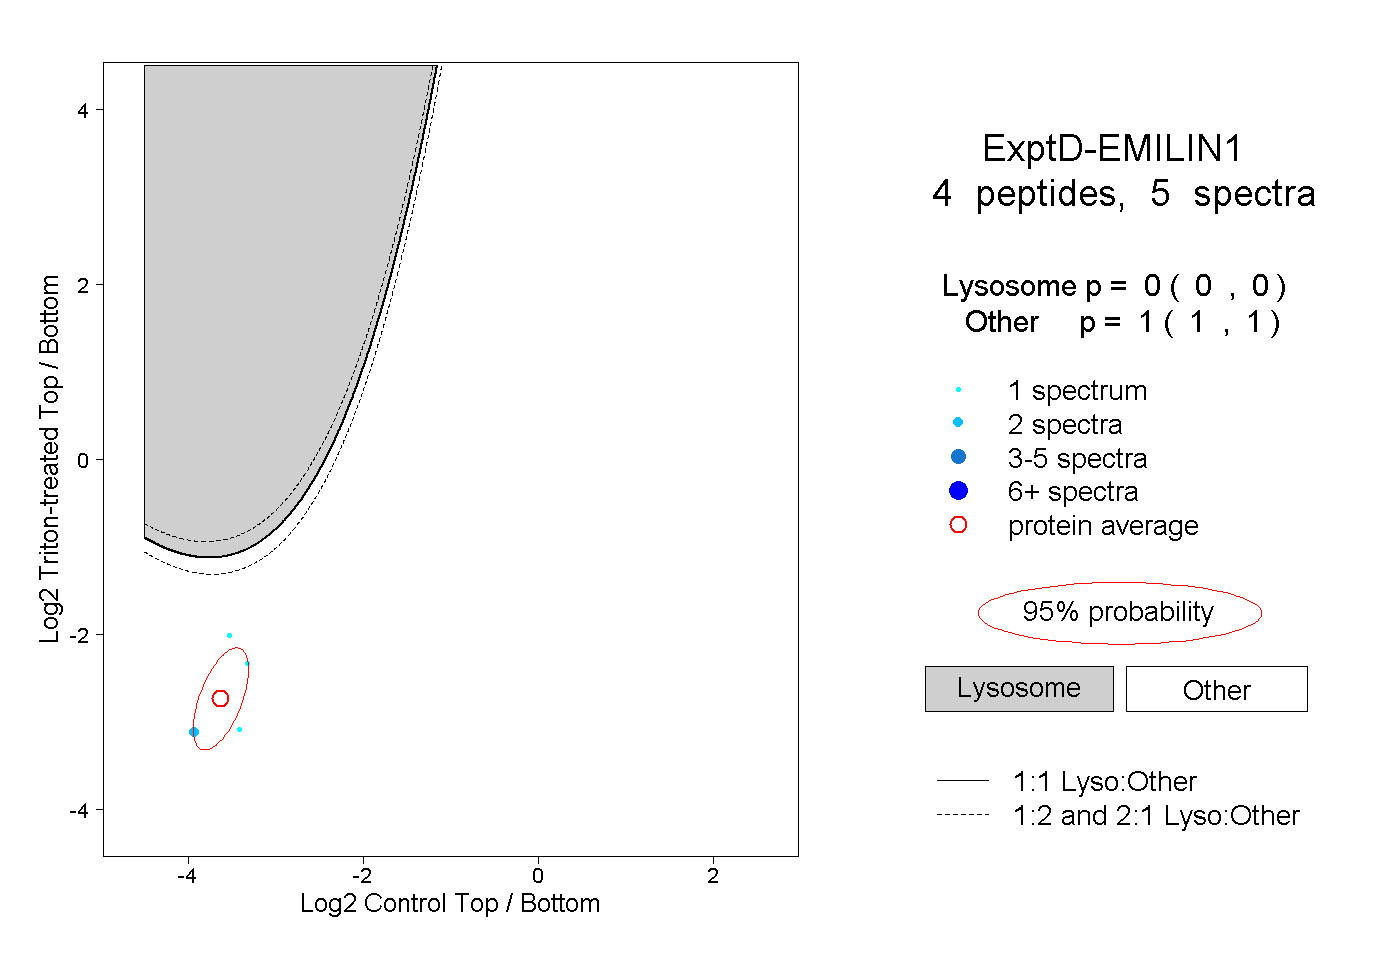
12peptides
spectra
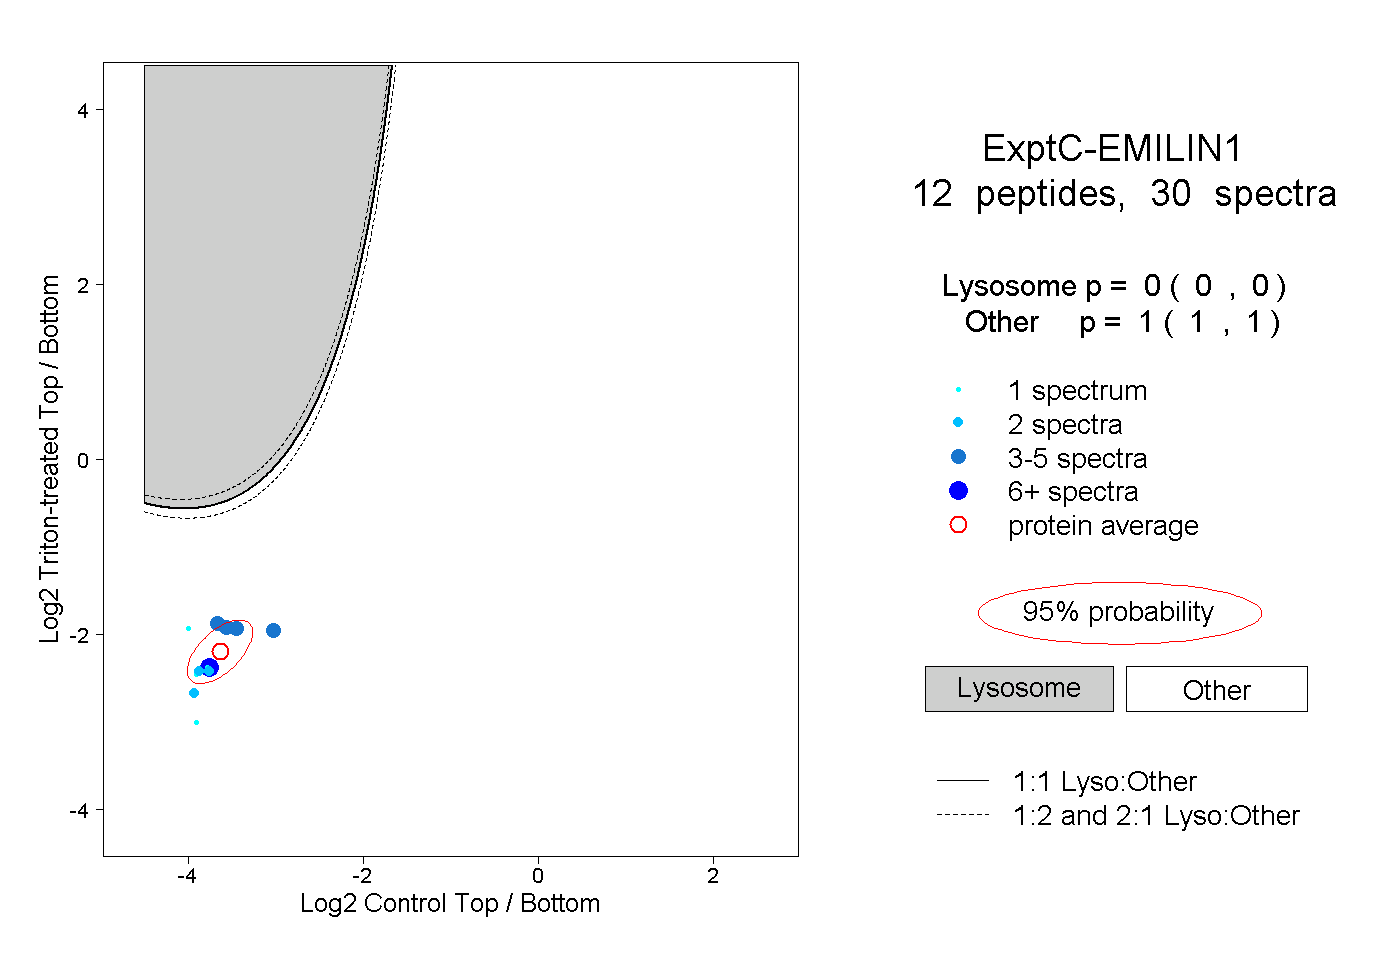
0.000 | 0.000
1.000 | 1.000