 20
20peptides
spectra
0.083 | 0.097
0.000 | 0.000
0.000 | 0.000
0.000 | 0.000
0.000 | 0.000
0.490 | 0.504
0.000 | 0.000
0.408 | 0.416
| Plot | Mito | Lyso | Perox | ER | Golgi | PM | Cytosol | Nucleus | |||||
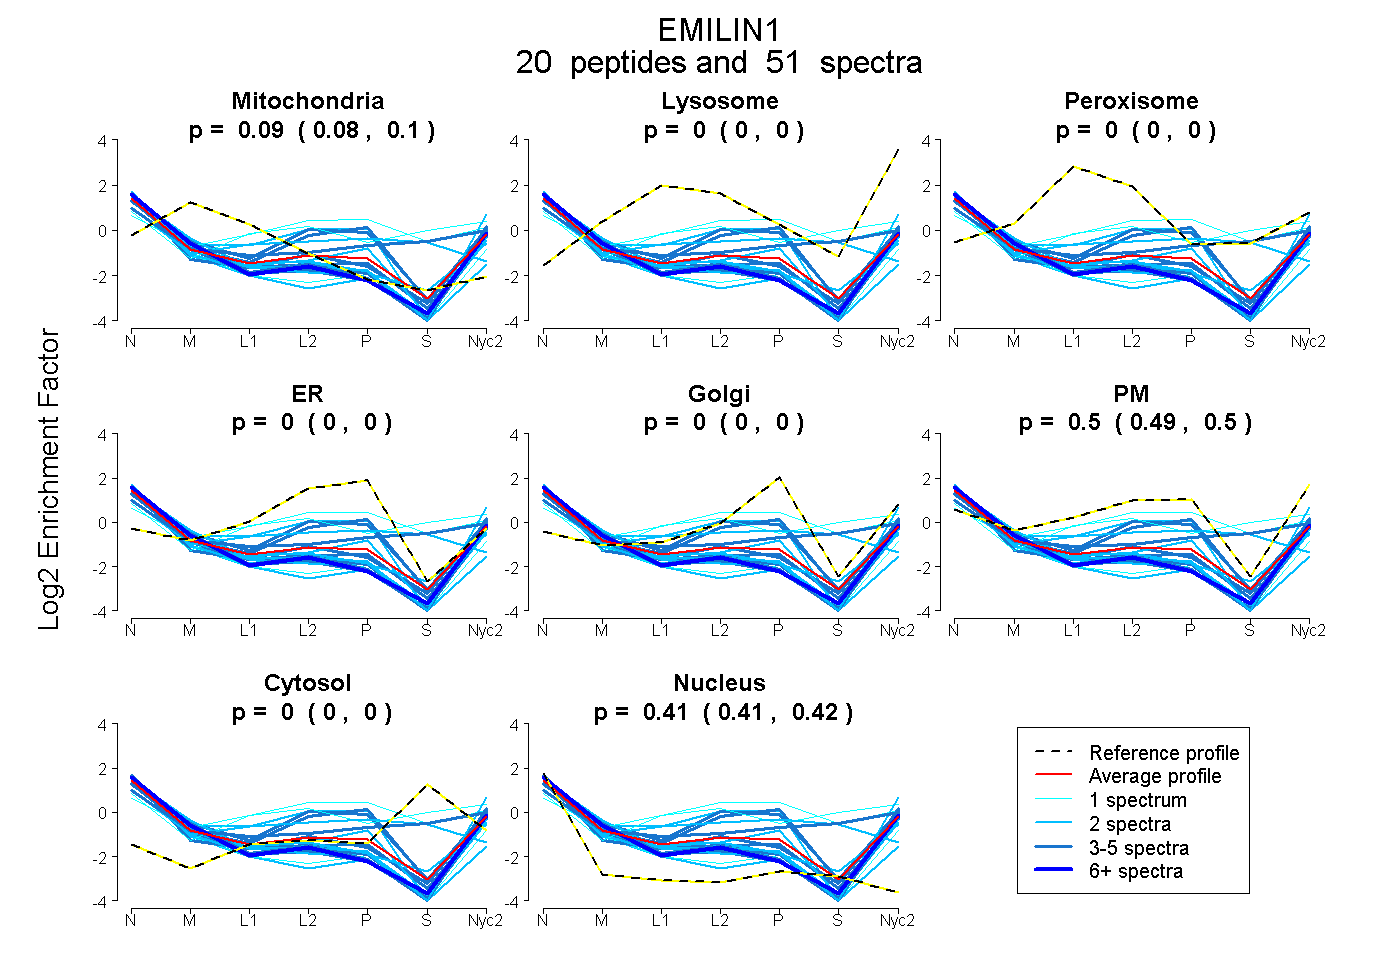
| Expt A |
20 peptides |
51 spectra |
|
0.090 0.083 | 0.097 |
0.000 0.000 | 0.000 |
0.000 0.000 | 0.000 |
0.000 0.000 | 0.000 |
0.000 0.000 | 0.000 |
0.497 0.490 | 0.504 |
0.000 0.000 | 0.000 |
0.413 0.408 | 0.416 |
| 2 spectra, LDVVAGSVTVLSGR | 0.069 | 0.000 | 0.000 | 0.000 | 0.000 | 0.423 | 0.000 | 0.508 | ||
| 3 spectra, VQQLEQQVK | 0.055 | 0.000 | 0.000 | 0.000 | 0.000 | 0.425 | 0.348 | 0.172 | ||
| 1 spectrum, MDTQEETAAELSLR | 0.000 | 0.000 | 0.207 | 0.000 | 0.000 | 0.353 | 0.364 | 0.076 | ||
| 3 spectra, GPGAGPGVGGPSR | 0.001 | 0.000 | 0.000 | 0.000 | 0.000 | 0.487 | 0.000 | 0.512 | ||
| 2 spectra, ACGQICSEGPGEQDSR | 0.172 | 0.000 | 0.000 | 0.000 | 0.000 | 0.202 | 0.000 | 0.626 | ||
| 2 spectra, DSIISEINR | 0.048 | 0.000 | 0.000 | 0.027 | 0.000 | 0.672 | 0.000 | 0.253 | ||
| 3 spectra, HVAGLWAAVR | 0.036 | 0.000 | 0.000 | 0.000 | 0.000 | 0.681 | 0.000 | 0.283 | ||
| 1 spectrum, LQQEATEHITEIEER | 0.000 | 0.000 | 0.144 | 0.112 | 0.000 | 0.421 | 0.279 | 0.044 | ||
| 1 spectrum, ASAPVPVPSGPSEELLR | 0.104 | 0.000 | 0.000 | 0.000 | 0.000 | 0.309 | 0.000 | 0.588 | ||
| 3 spectra, GVLQGMNGR | 0.077 | 0.000 | 0.000 | 0.000 | 0.000 | 0.496 | 0.000 | 0.427 | ||
| 2 spectra, LAEDVQR | 0.000 | 0.000 | 0.000 | 0.000 | 0.000 | 0.520 | 0.000 | 0.480 | ||
| 2 spectra, VAFSAALSLPR | 0.070 | 0.000 | 0.000 | 0.000 | 0.000 | 0.520 | 0.000 | 0.410 | ||
| 3 spectra, QQQLMGPAMAR | 0.141 | 0.000 | 0.000 | 0.000 | 0.000 | 0.415 | 0.000 | 0.445 | ||
| 3 spectra, LDLLEEQVAGAVR | 0.131 | 0.000 | 0.000 | 0.000 | 0.000 | 0.360 | 0.000 | 0.510 | ||
| 2 spectra, LEGVCER | 0.108 | 0.106 | 0.000 | 0.000 | 0.000 | 0.248 | 0.000 | 0.538 | ||
| 2 spectra, RPPQECCPPELGR | 0.000 | 0.000 | 0.249 | 0.158 | 0.000 | 0.073 | 0.217 | 0.304 | ||
| 6 spectra, VSEILSALER | 0.167 | 0.000 | 0.000 | 0.000 | 0.000 | 0.367 | 0.000 | 0.465 | ||
| 4 spectra, LQQLSLK | 0.000 | 0.000 | 0.000 | 0.000 | 0.021 | 0.659 | 0.000 | 0.320 | ||
| 2 spectra, LMSSMEER | 0.181 | 0.000 | 0.000 | 0.000 | 0.000 | 0.417 | 0.000 | 0.402 | ||
| 4 spectra, LLGGQAGLGR | 0.097 | 0.000 | 0.000 | 0.000 | 0.000 | 0.438 | 0.000 | 0.465 |
| Plot | Mito | Lyso or Perox | ER | Golgi | PM | Cytosol | Nucleus | ||||||
| Expt B |
6 peptides |
9 spectra |
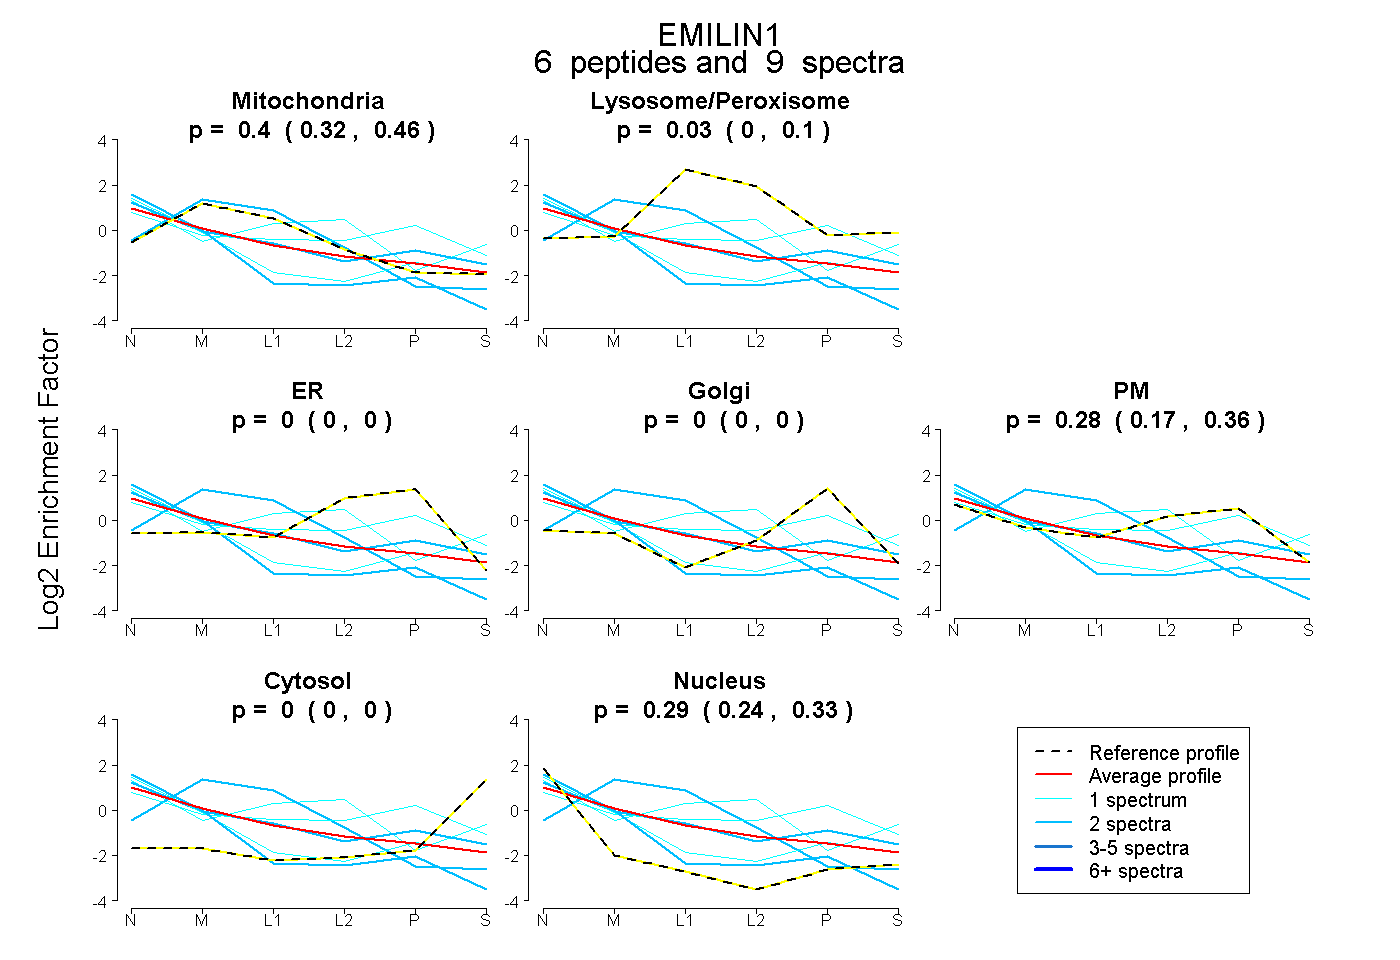 |
0.400 0.324 | 0.456 |
0.032 0.000 | 0.102 |
0.000 0.000 | 0.000 |
0.000 0.000 | 0.000 |
0.280 0.168 | 0.357 |
0.000 0.000 | 0.000 |
0.288 0.240 | 0.335 |
|||
| Plot | Lyso | Other | |||||||||||
| Expt C |
12 peptides |
30 spectra |
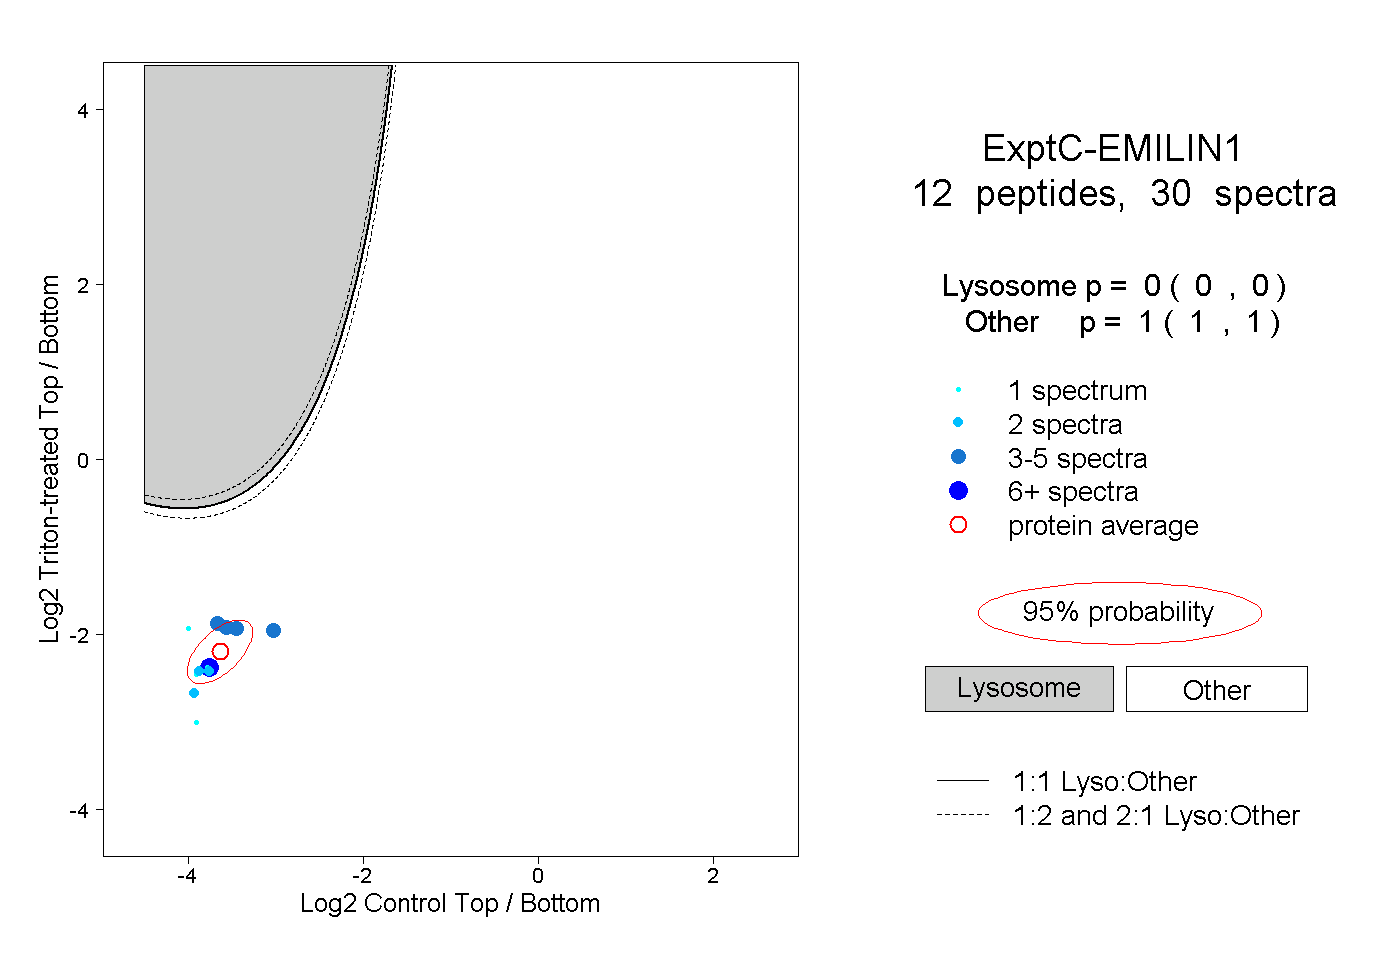 |
0.000 0.000 | 0.000 |
1.000 1.000 | 1.000 |
||||||||
| Plot | Lyso | Other | |||||||||||
| Expt D |
4 peptides |
5 spectra |
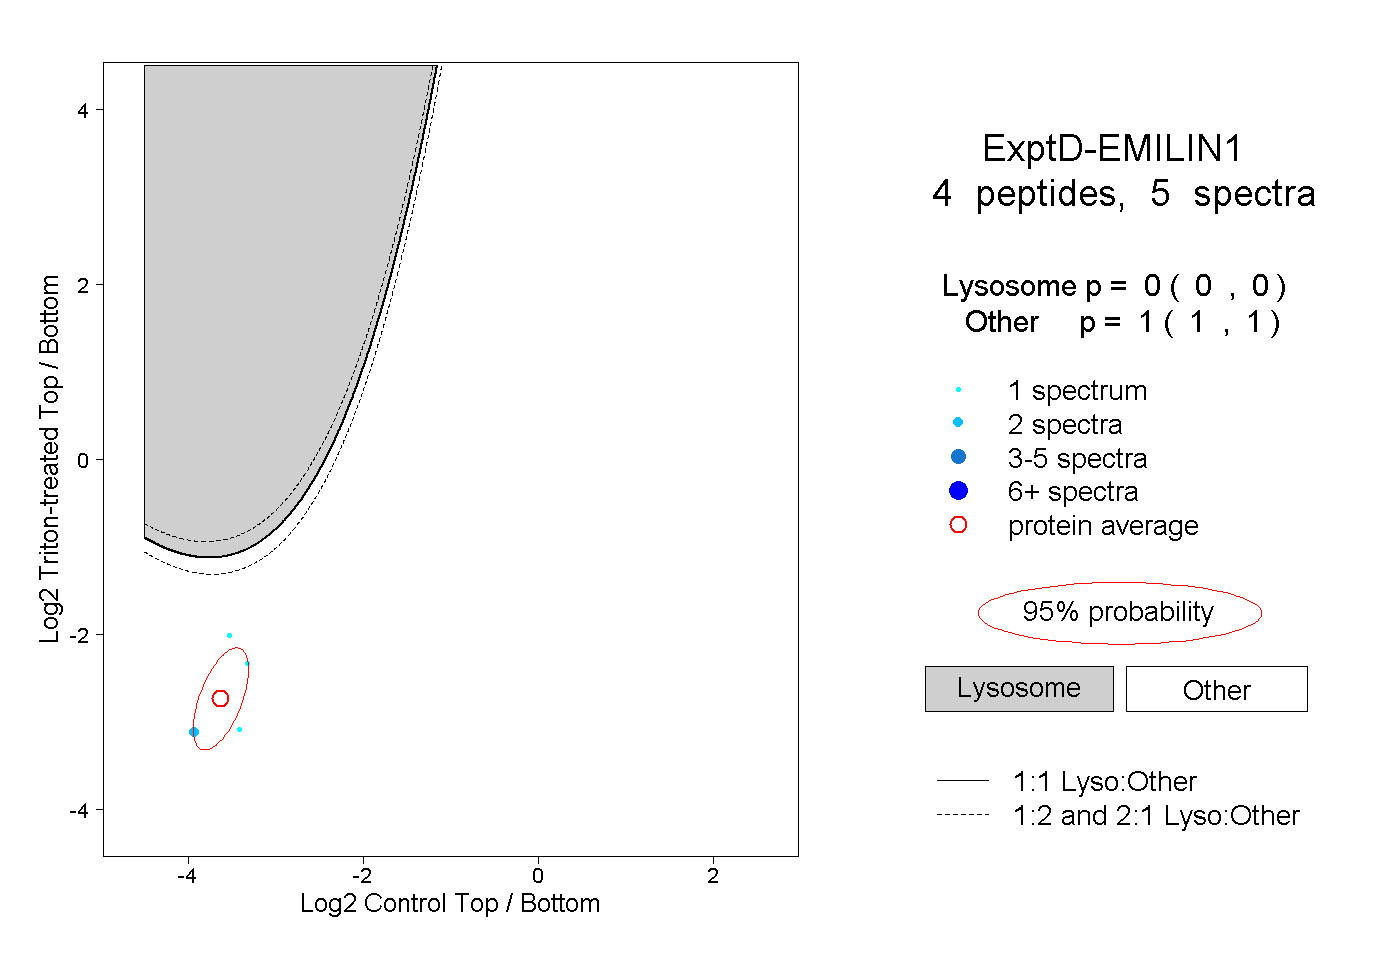 |
0.000 0.000 | 0.000 |
1.000 1.000 | 1.000 |