 1
1peptide
spectra
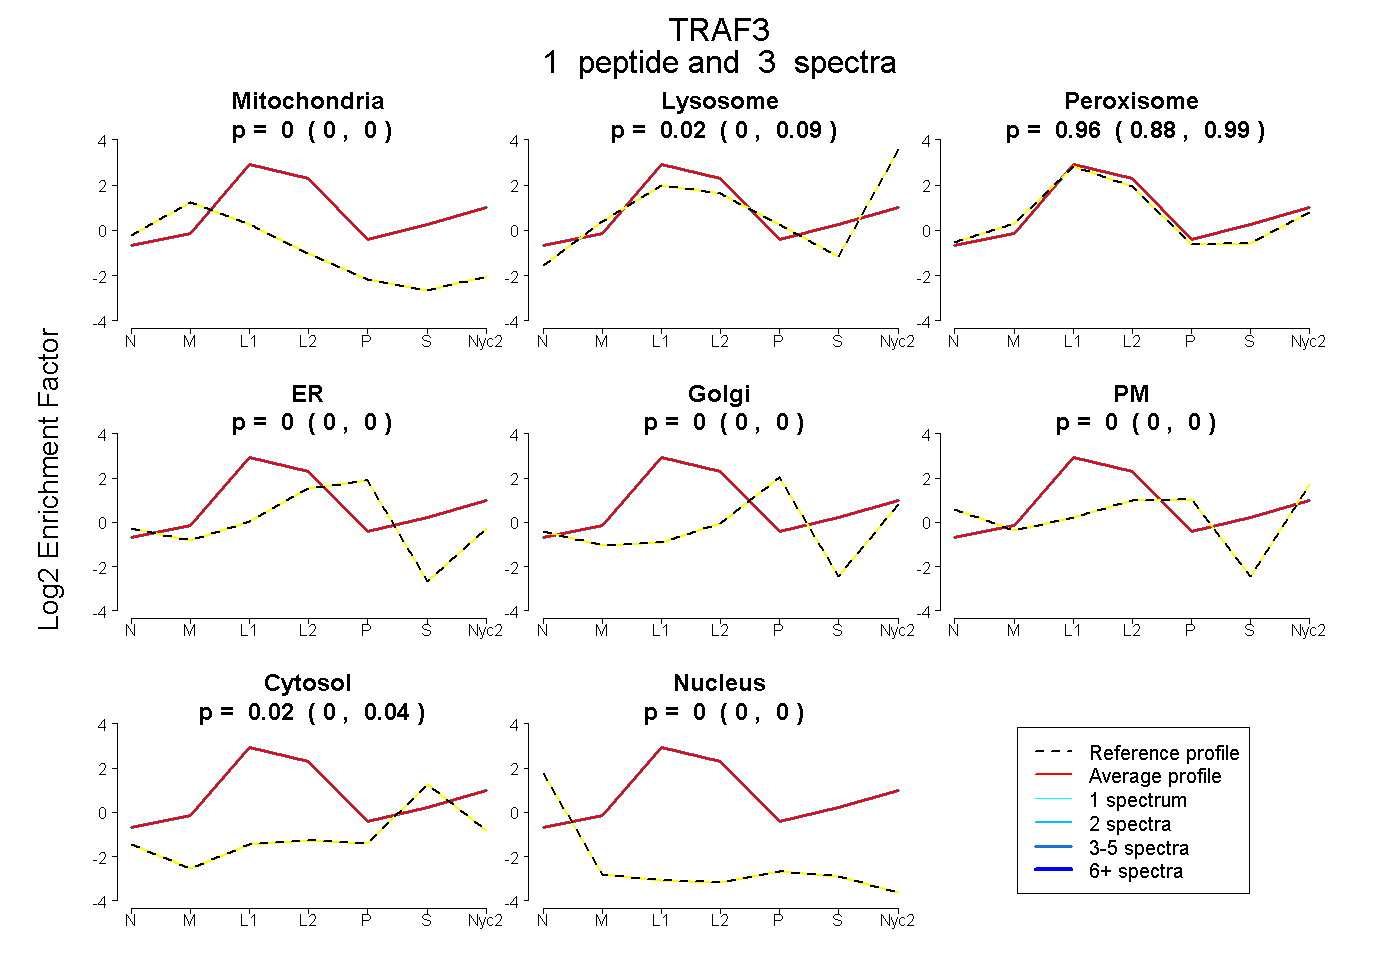
0.000 | 0.000
0.000 | 0.086
0.885 | 0.991
0.000 | 0.000
0.000 | 0.000
0.000 | 0.000
0.000 | 0.037
0.000 | 0.000
1peptide
spectra
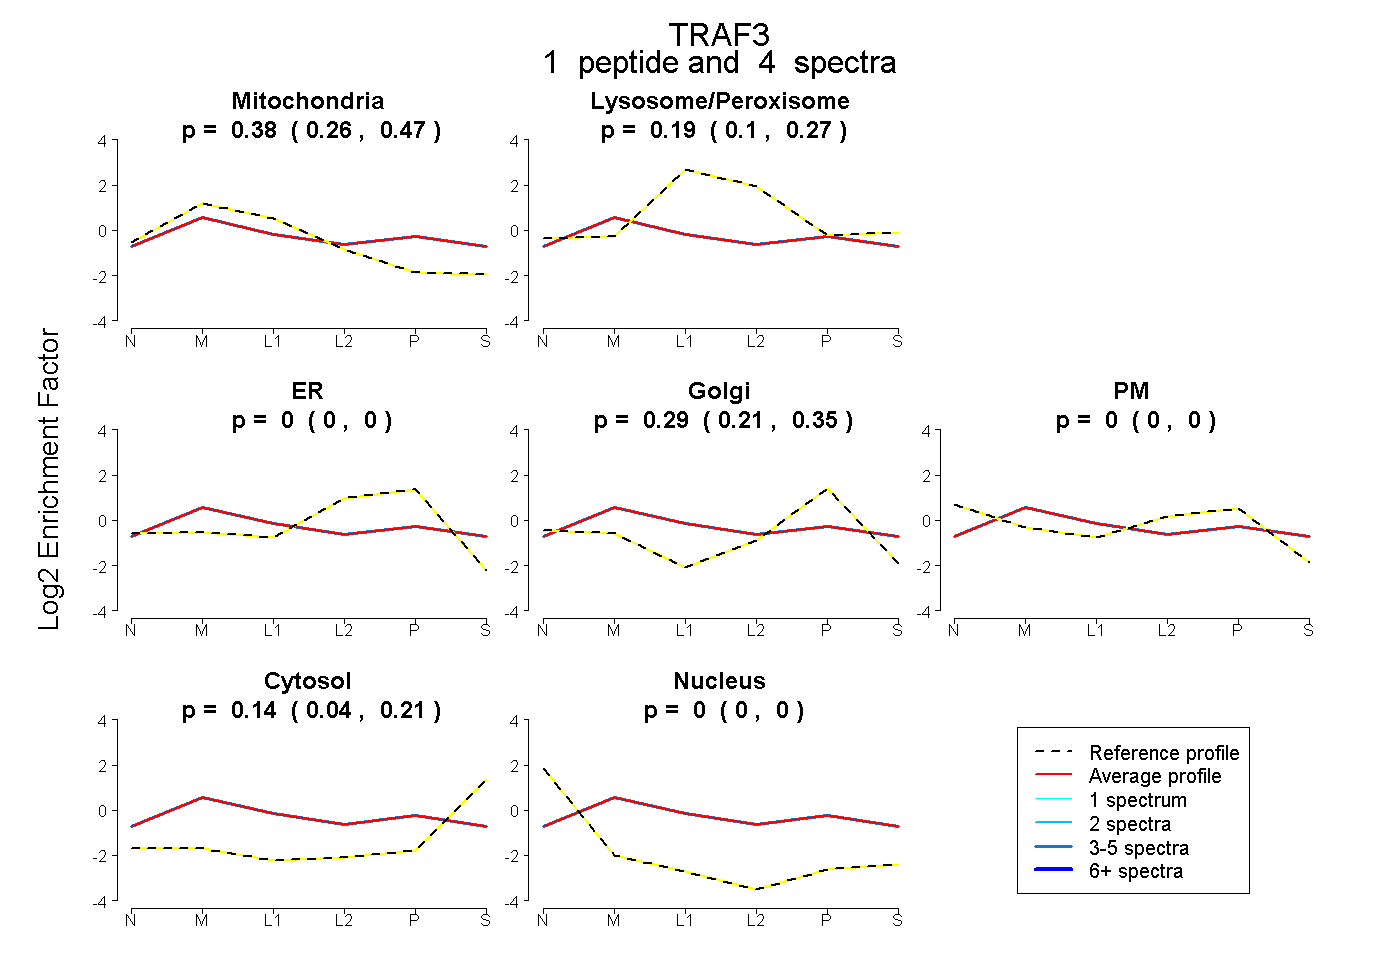
0.265 | 0.473
0.102 | 0.271
0.000 | 0.000
0.214 | 0.353
0.000 | 0.000
0.042 | 0.215
0.000 | 0.000
1peptide
spectrum
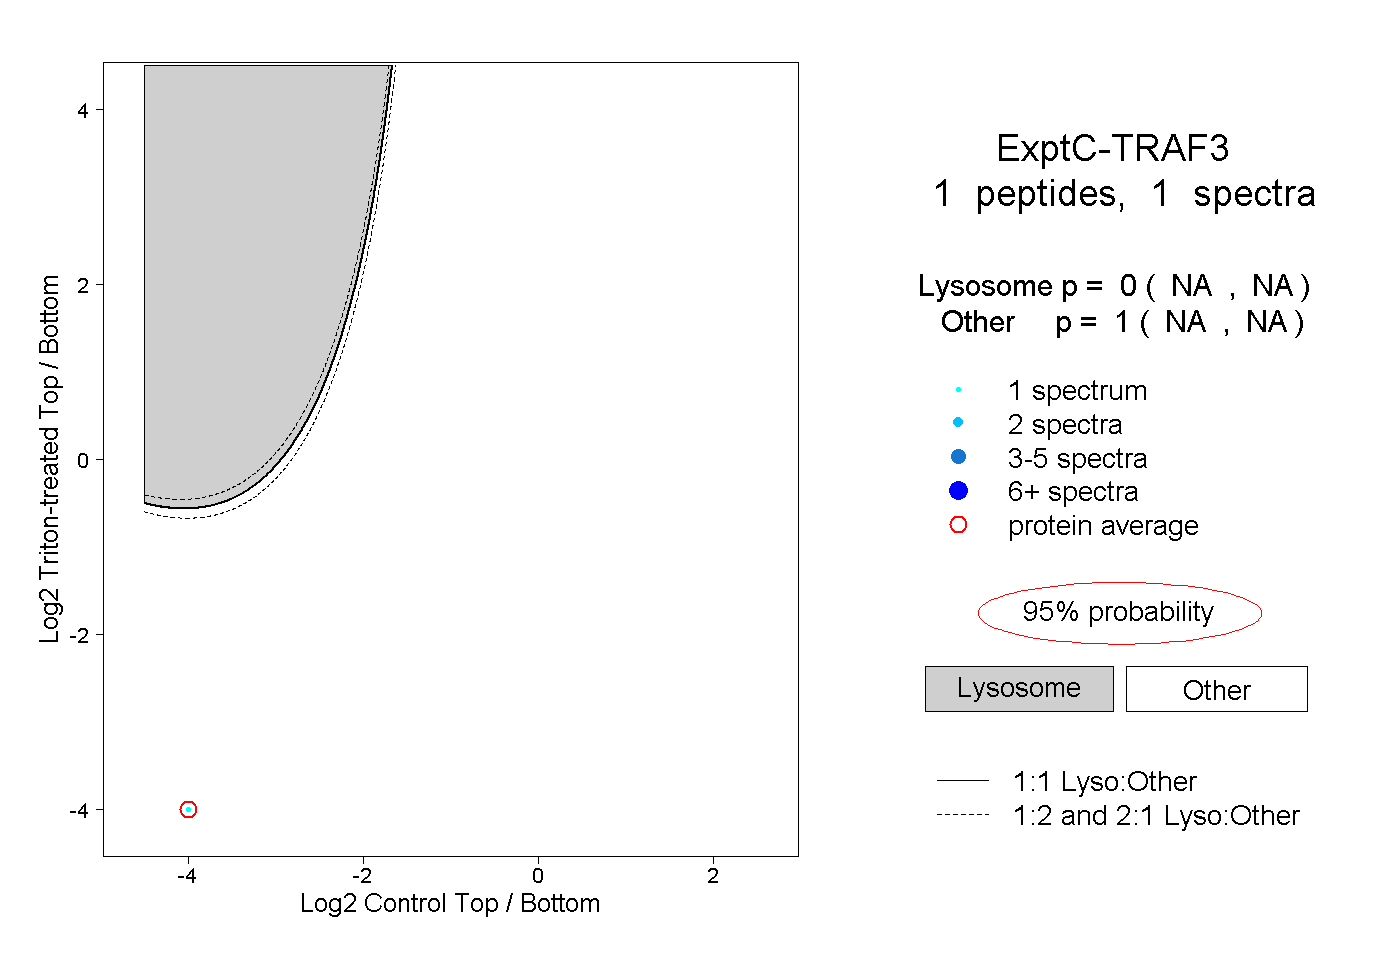
NA | NA
NA | NA