 2
2peptides
spectra
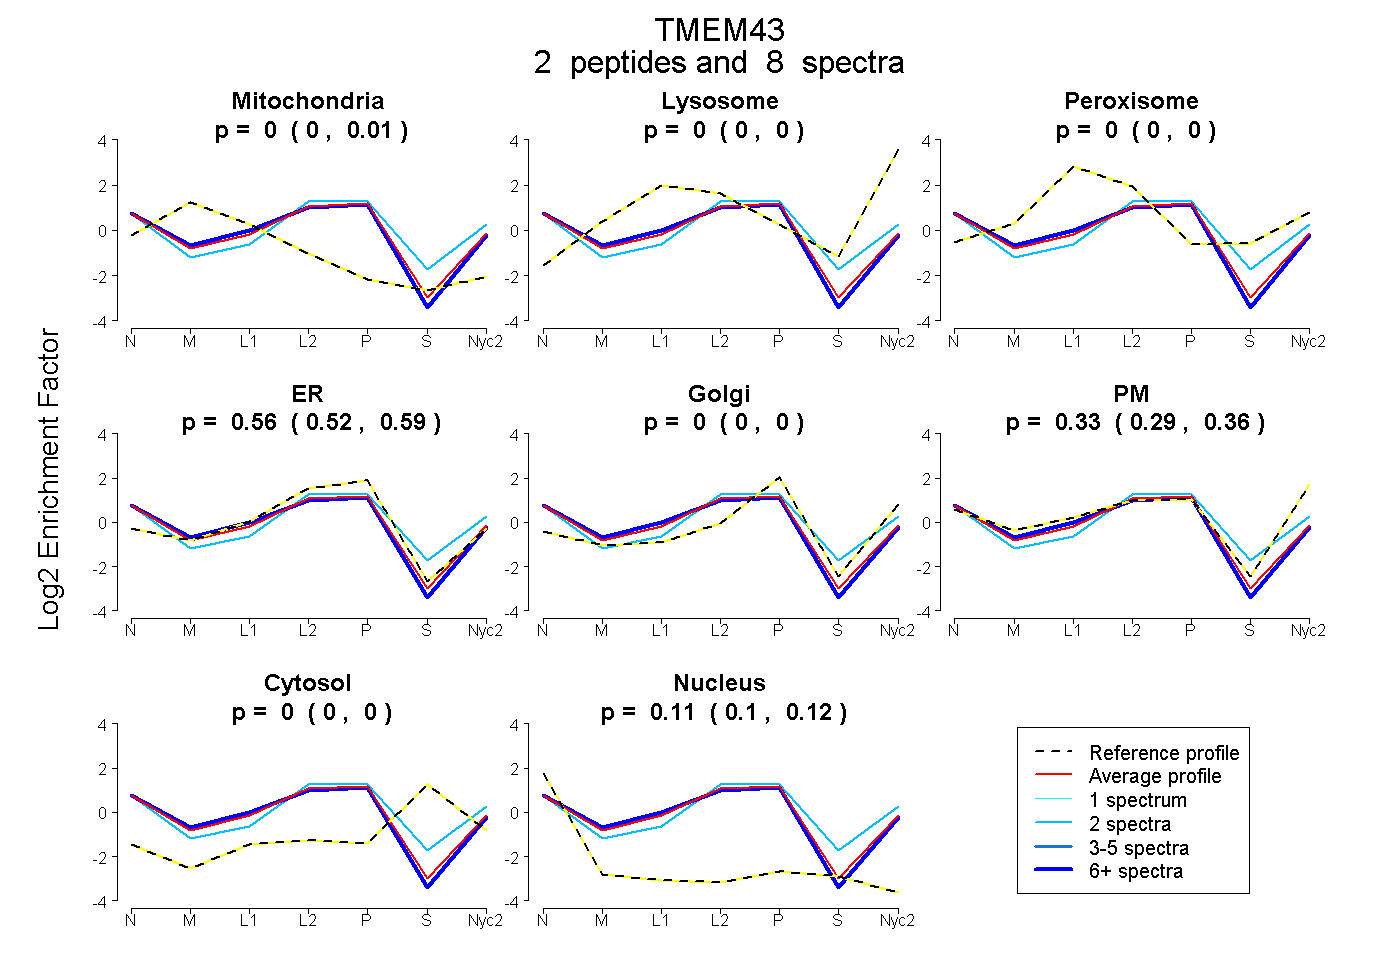
0.000 | 0.009
0.000 | 0.000
0.000 | 0.000
0.519 | 0.595
0.000 | 0.000
0.292 | 0.363
0.000 | 0.000
0.096 | 0.119
1peptide
spectra
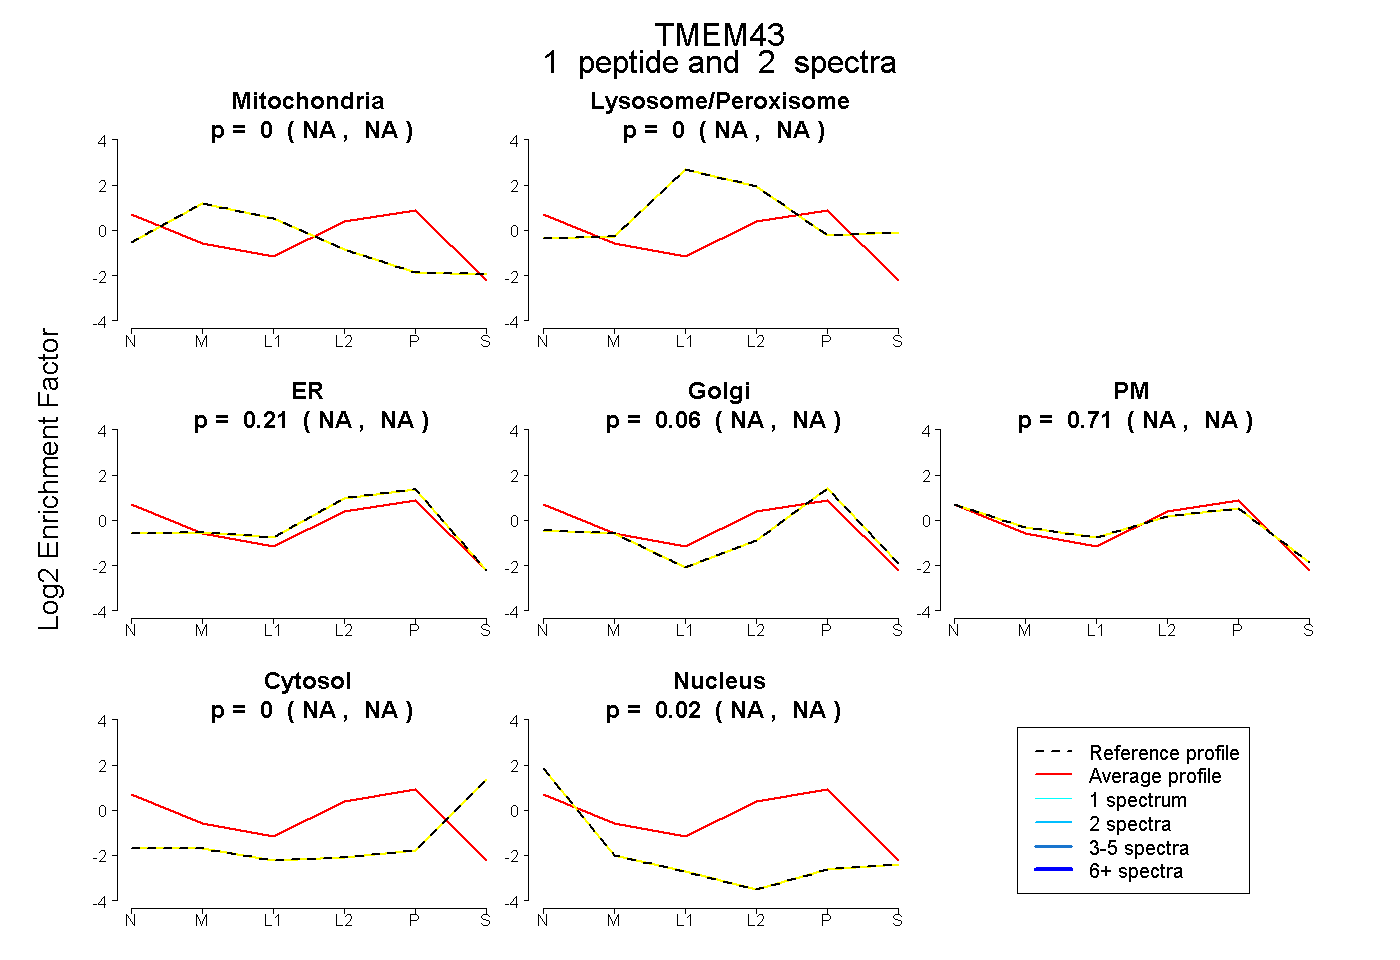
NA | NA
NA | NA
NA | NA
NA | NA
NA | NA
NA | NA
NA | NA
5peptides
spectra
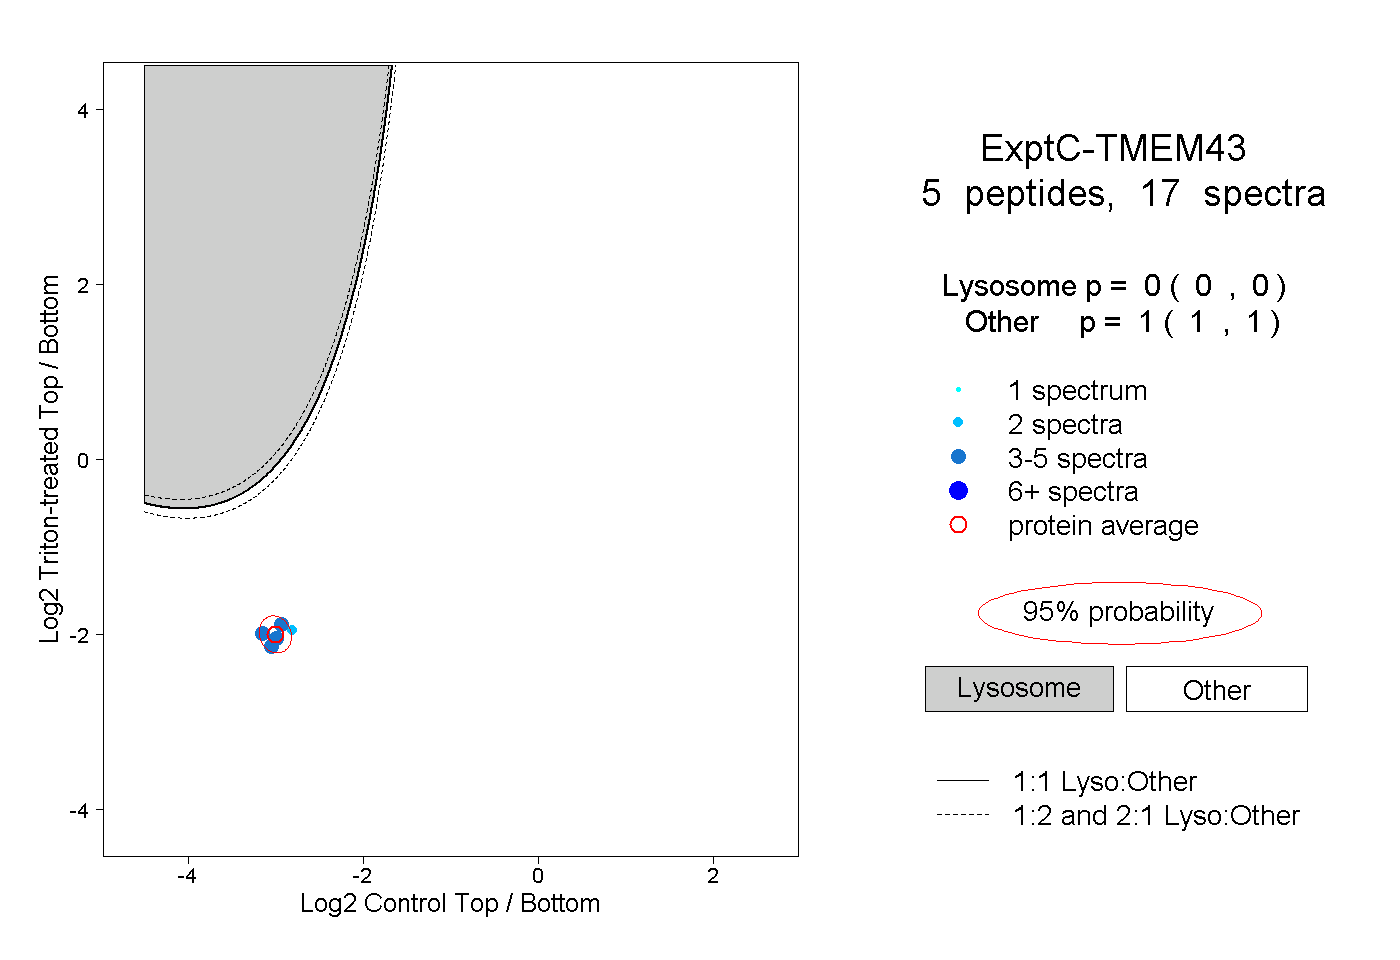
0.000 | 0.000
1.000 | 1.000
1peptide
spectra
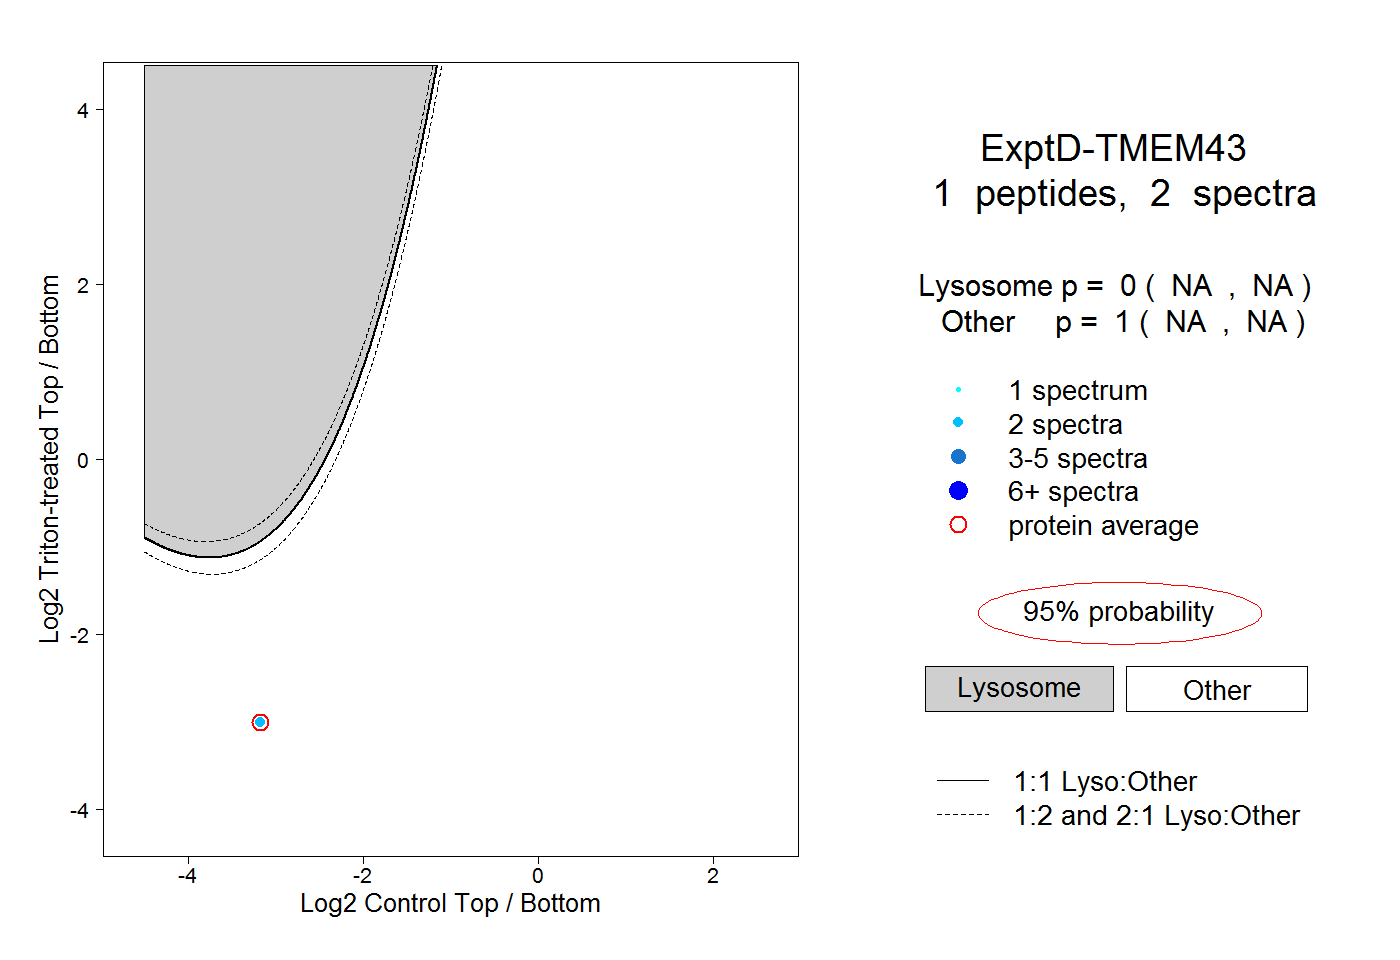
NA | NA
NA | NA