9
9peptides
spectra
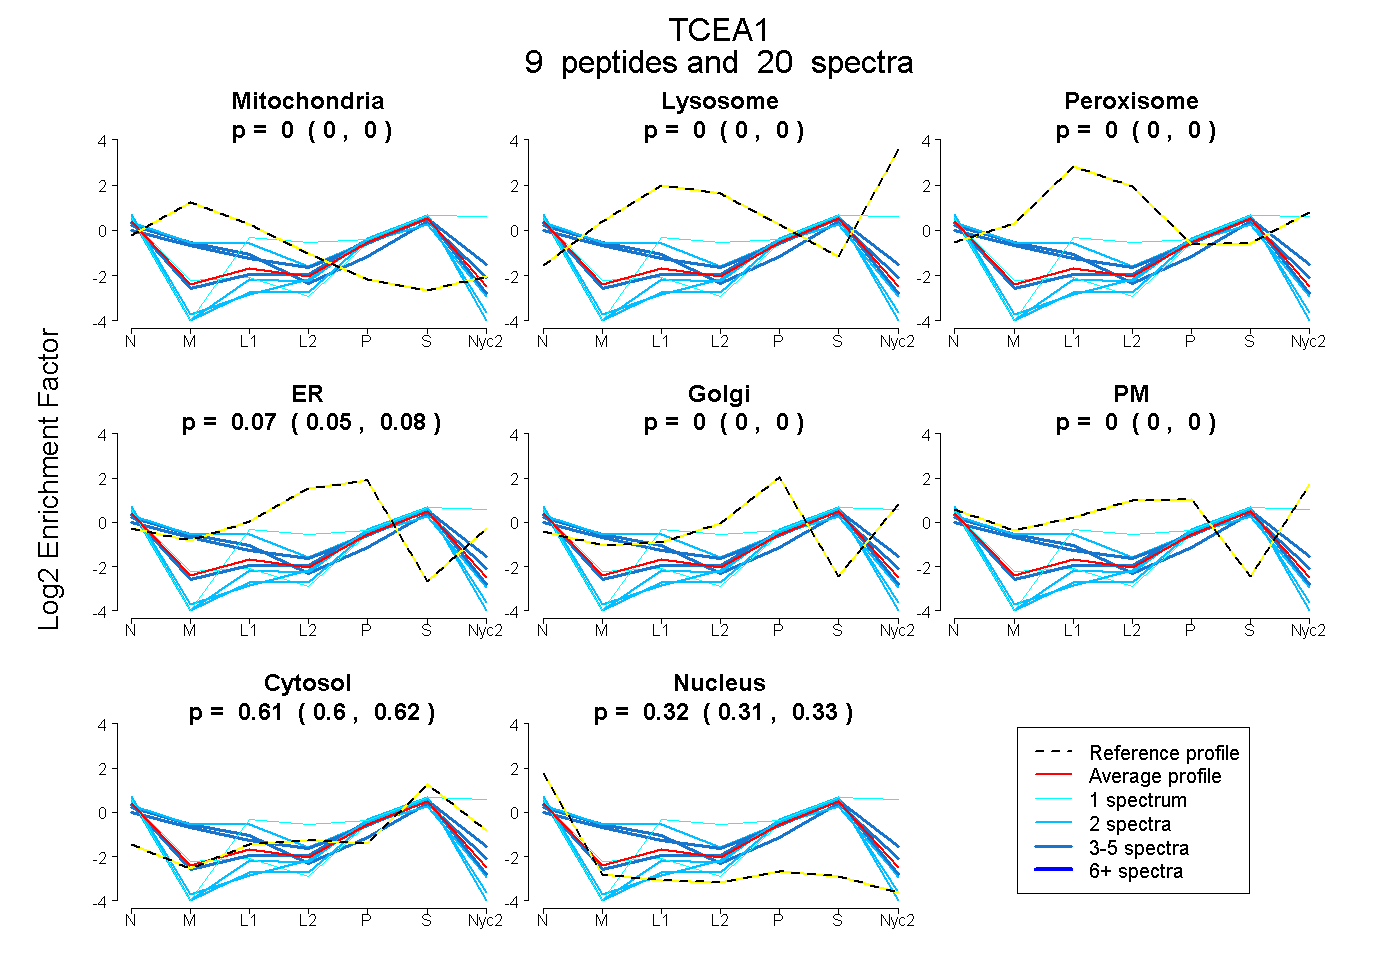
0.000 | 0.000
0.000 | 0.000
0.000 | 0.000
0.053 | 0.081
0.000 | 0.000
0.000 | 0.000
0.597 | 0.620
0.308 | 0.335
5peptides
spectra
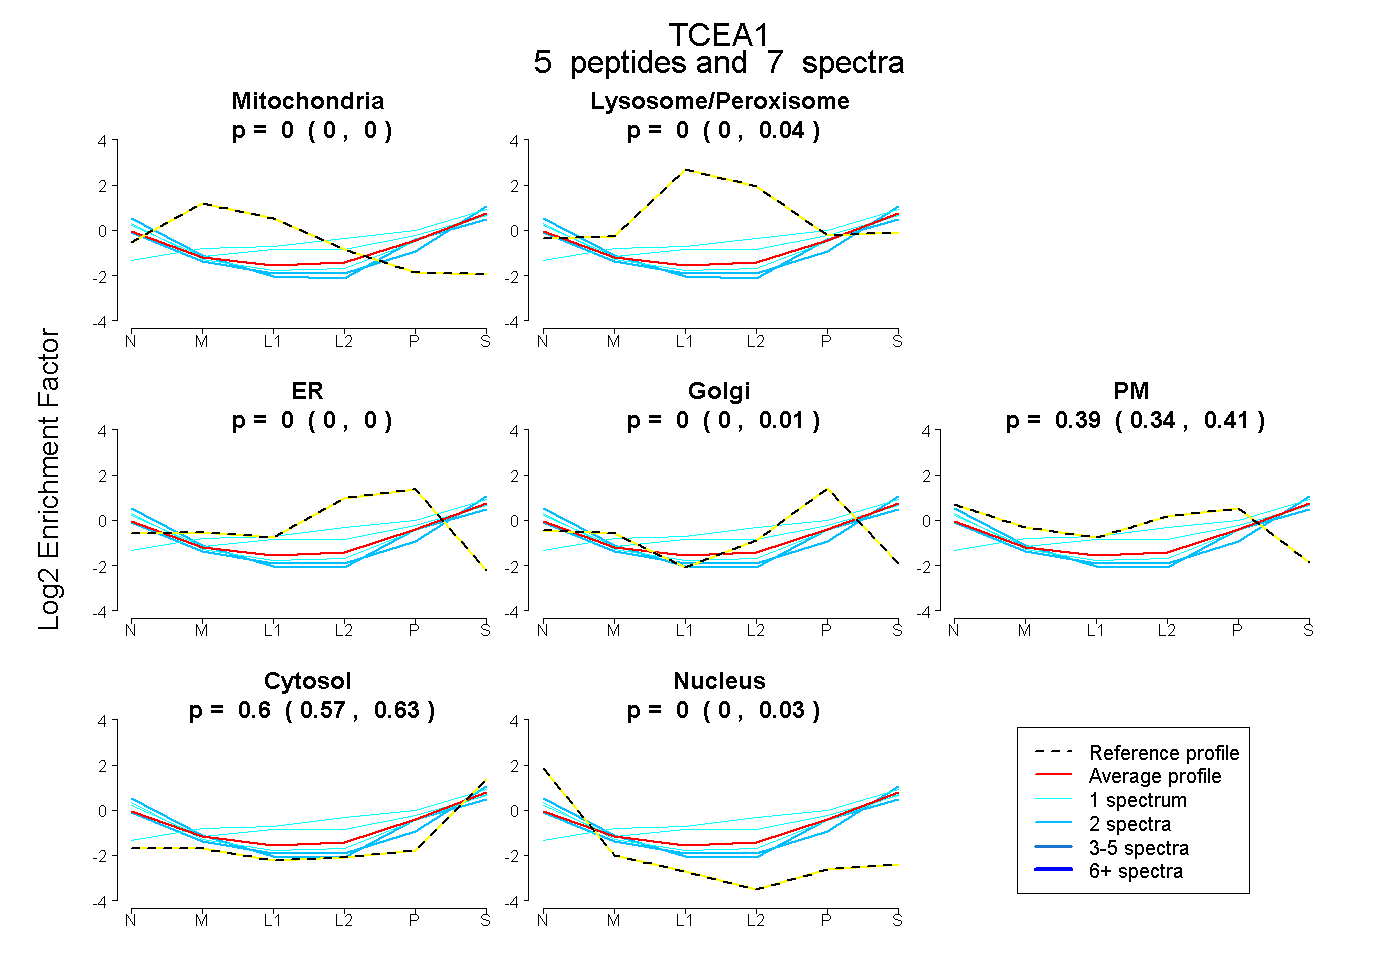
0.000 | 0.000
0.000 | 0.043
0.000 | 0.000
0.000 | 0.007
0.339 | 0.411
0.565 | 0.628
0.000 | 0.033