 9
9peptides
spectra
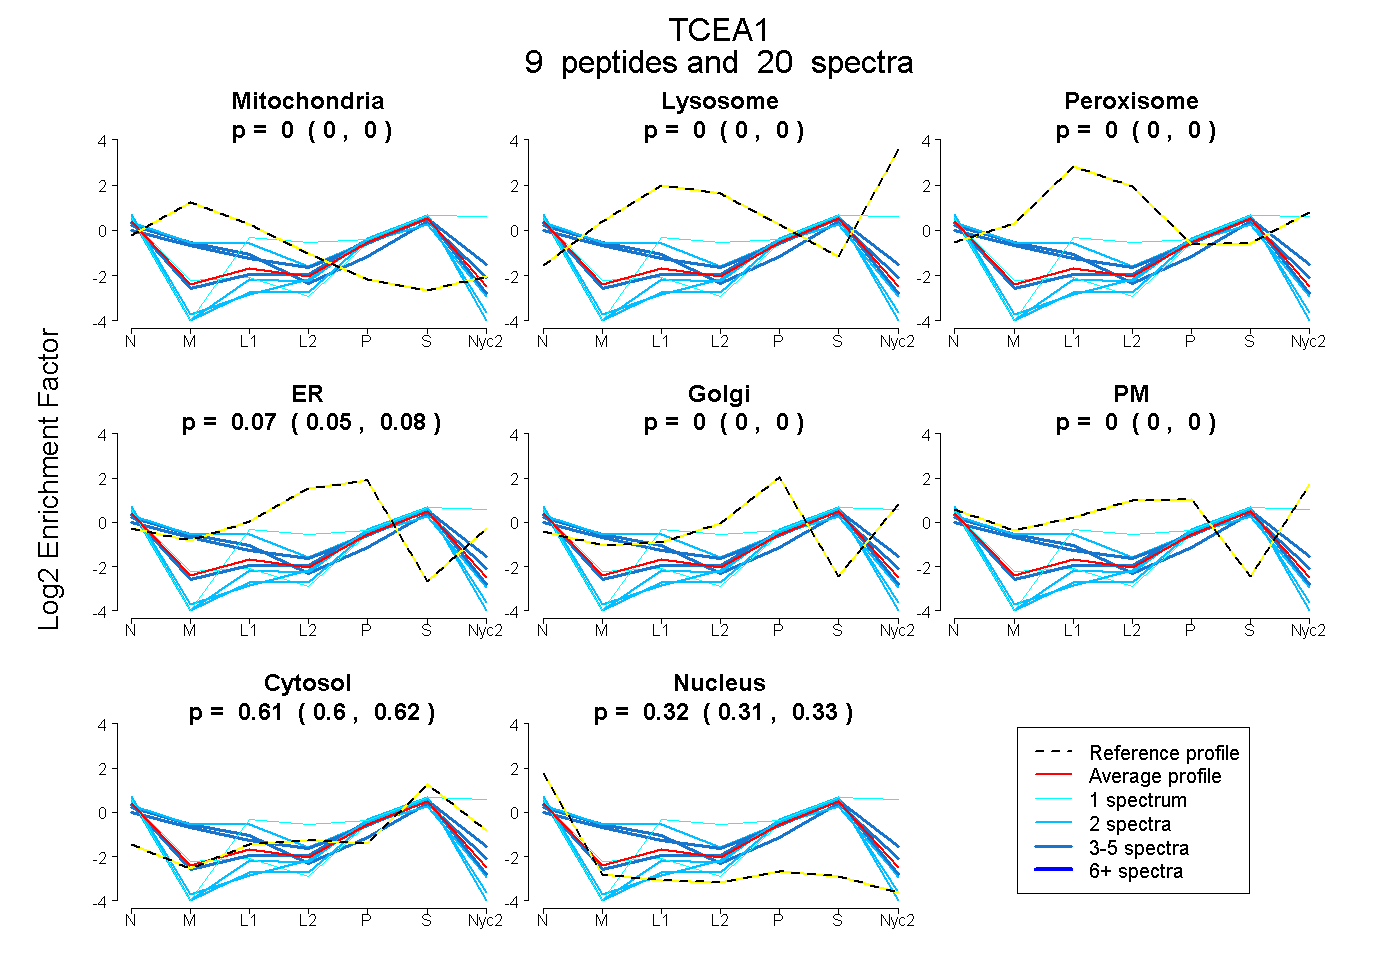
0.000 | 0.000
0.000 | 0.000
0.000 | 0.000
0.053 | 0.081
0.000 | 0.000
0.000 | 0.000
0.597 | 0.620
0.308 | 0.335
| Plot | Mito | Lyso | Perox | ER | Golgi | PM | Cytosol | Nucleus | |||||
| Expt A |
9 peptides |
20 spectra |
|
0.000 0.000 | 0.000 |
0.000 0.000 | 0.000 |
0.000 0.000 | 0.000 |
0.068 0.053 | 0.081 |
0.000 0.000 | 0.000 |
0.000 0.000 | 0.000 |
0.610 0.597 | 0.620 |
0.322 0.308 | 0.335 |
| 2 spectra, NAAGALDLLK | 0.000 | 0.000 | 0.000 | 0.000 | 0.000 | 0.000 | 0.518 | 0.482 | ||
| 3 spectra, MTAEEMASDELK | 0.276 | 0.000 | 0.000 | 0.032 | 0.000 | 0.000 | 0.547 | 0.145 | ||
| 2 spectra, DTYVSSFPR | 0.000 | 0.000 | 0.000 | 0.000 | 0.000 | 0.000 | 0.612 | 0.388 | ||
| 3 spectra, IGMSVNAIR | 0.000 | 0.000 | 0.000 | 0.000 | 0.125 | 0.000 | 0.625 | 0.249 | ||
| 4 spectra, APSTSDSVR | 0.322 | 0.000 | 0.000 | 0.000 | 0.000 | 0.000 | 0.532 | 0.146 | ||
| 2 spectra, NCTYTQVQTR | 0.000 | 0.000 | 0.000 | 0.000 | 0.000 | 0.000 | 0.483 | 0.517 | ||
| 2 spectra, EHQMAK | 0.347 | 0.000 | 0.000 | 0.067 | 0.000 | 0.000 | 0.455 | 0.131 | ||
| 1 spectrum, EMLAAALR | 0.000 | 0.000 | 0.000 | 0.000 | 0.000 | 0.000 | 0.606 | 0.394 | ||
| 1 spectrum, SADEPMTTFVVCNECGNR | 0.000 | 0.000 | 0.000 | 0.000 | 0.000 | 0.297 | 0.703 | 0.000 |
| Plot | Mito | Lyso or Perox | ER | Golgi | PM | Cytosol | Nucleus | ||||||
| Expt B |
5 peptides |
7 spectra |
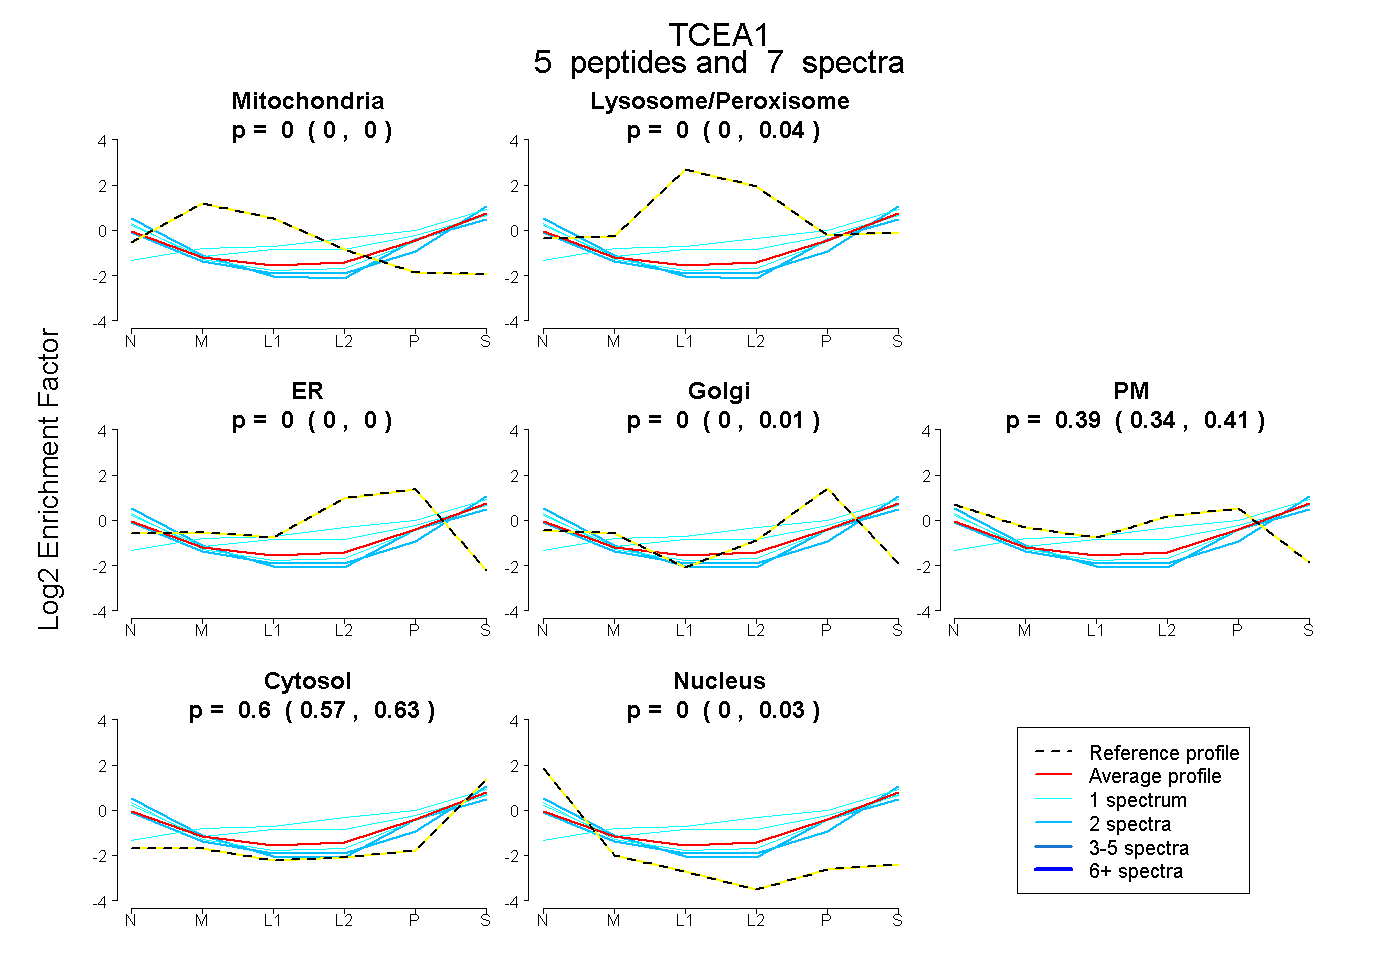 |
0.000 0.000 | 0.000 |
0.002 0.000 | 0.043 |
0.000 0.000 | 0.000 |
0.000 0.000 | 0.007 |
0.393 0.339 | 0.411 |
0.605 0.565 | 0.628 |
0.000 0.000 | 0.033 |
|||
| Plot | Lyso | Other | |||||||||||
| Expt C |
2 peptides |
3 spectra |
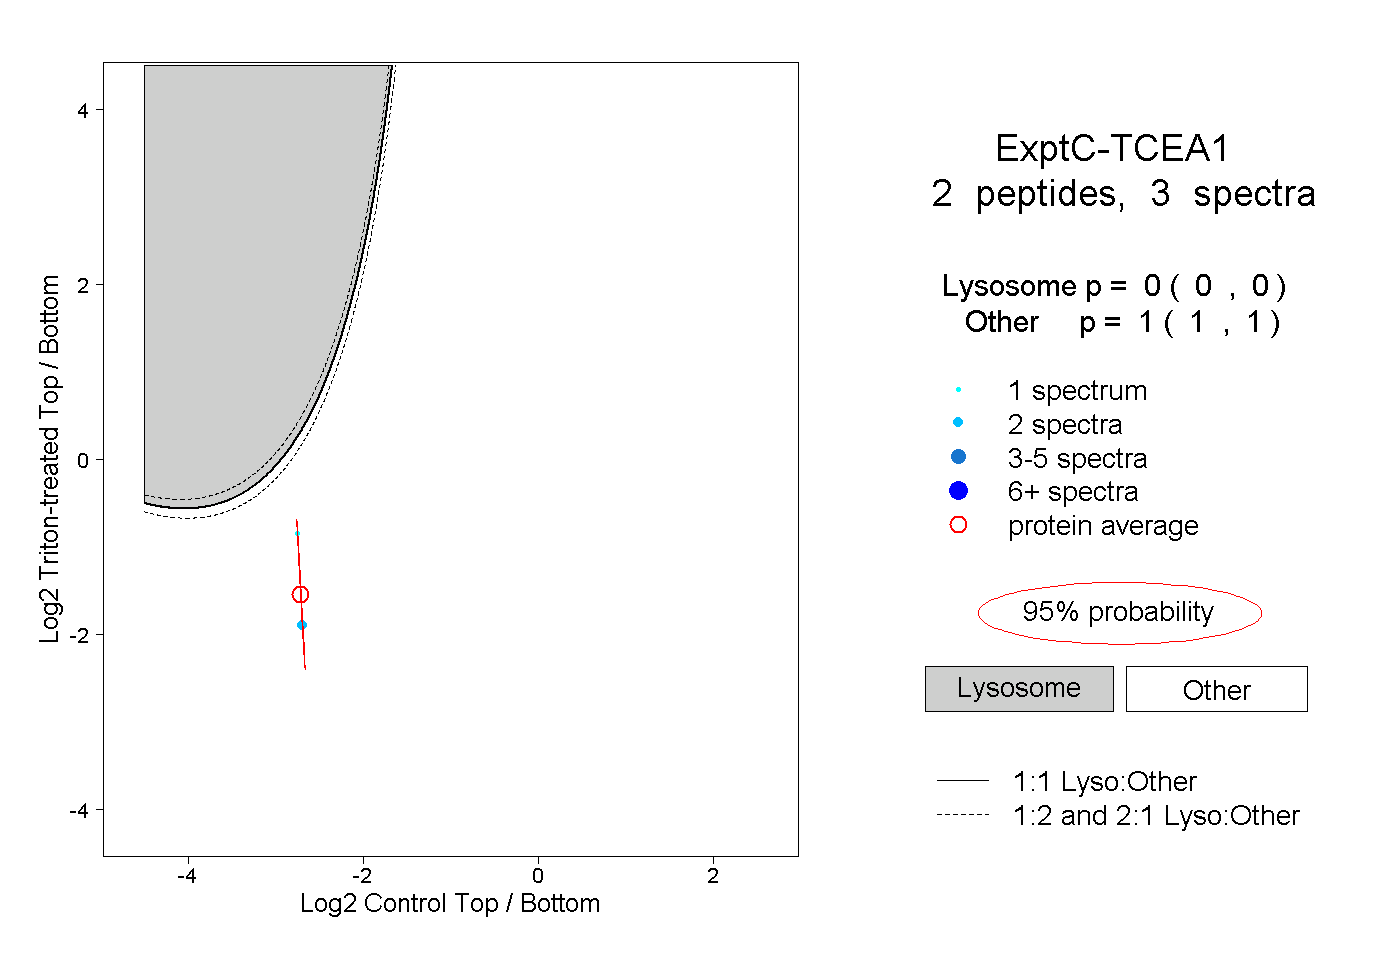 |
0.000 0.000 | 0.000 |
1.000 1.000 | 1.000 |