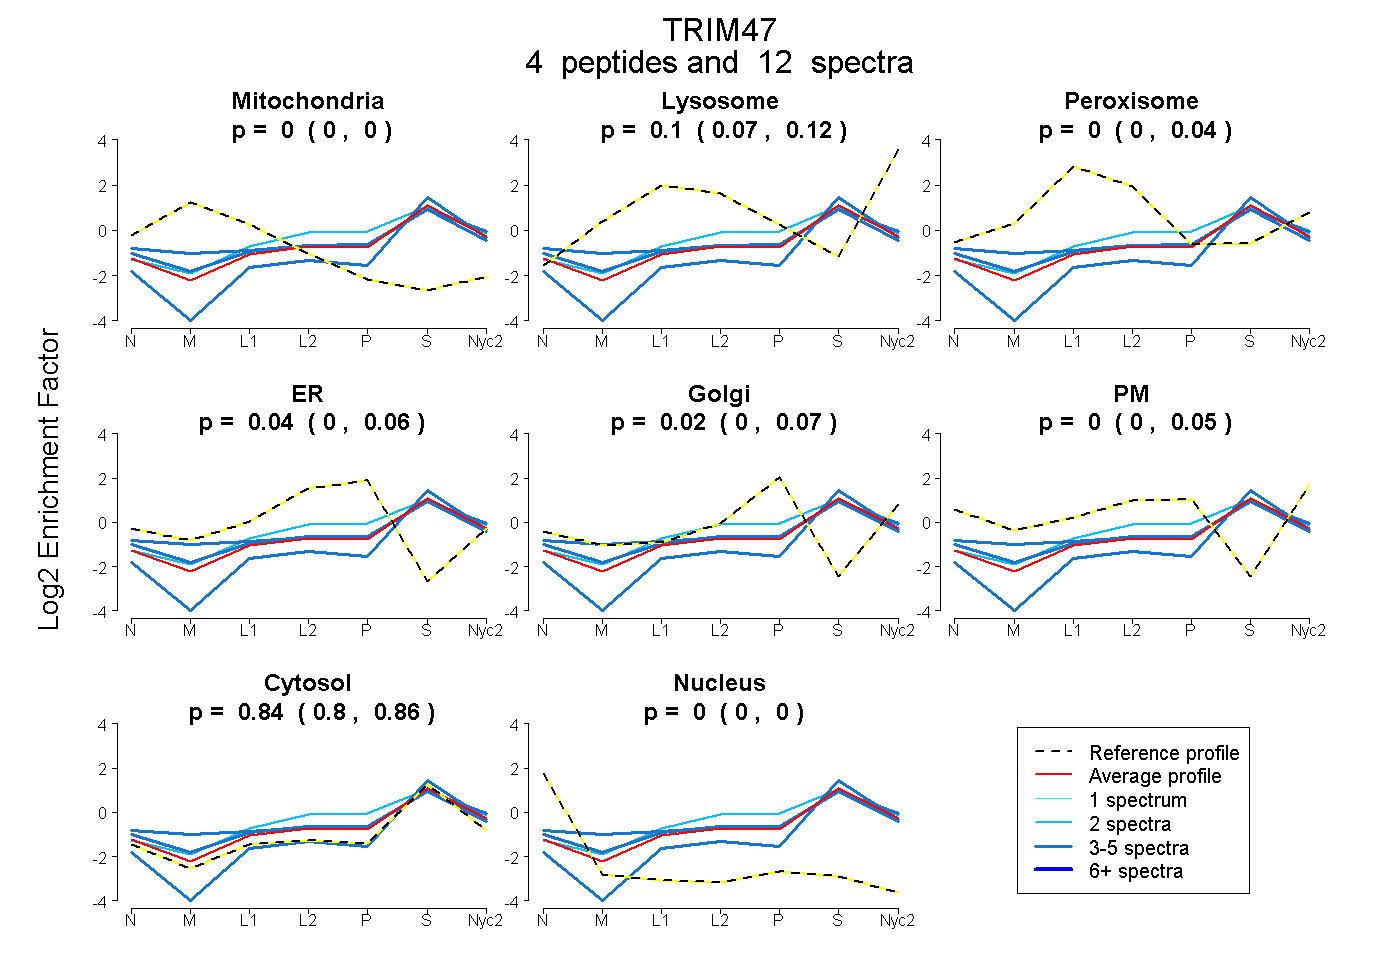
 4
4peptides
spectra
0.000 | 0.000
0.066 | 0.120
0.000 | 0.037
0.000 | 0.063
0.000 | 0.073
0.000 | 0.052
0.803 | 0.859
0.000 | 0.000
| Plot | Mito | Lyso | Perox | ER | Golgi | PM | Cytosol | Nucleus | |||||
| Expt A |
4 peptides |
12 spectra |
|
0.000 0.000 | 0.000 |
0.104 0.066 | 0.120 |
0.000 0.000 | 0.037 |
0.039 0.000 | 0.063 |
0.019 0.000 | 0.073 |
0.000 0.000 | 0.052 |
0.838 0.803 | 0.859 |
0.000 0.000 | 0.000 |
| 2 spectra, ALQEVEQSK | 0.000 | 0.135 | 0.011 | 0.151 | 0.000 | 0.000 | 0.703 | 0.000 | ||
| 3 spectra, LALEEGCGPGPGPPR | 0.000 | 0.000 | 0.126 | 0.000 | 0.118 | 0.002 | 0.754 | 0.000 | ||
| 4 spectra, SAGGTGGSGGPAR | 0.000 | 0.000 | 0.000 | 0.000 | 0.000 | 0.000 | 1.000 | 0.000 | ||
| 3 spectra, GLGSGEDELQK | 0.046 | 0.099 | 0.051 | 0.000 | 0.000 | 0.109 | 0.696 | 0.000 |
| Plot | Lyso | Other | |||||||||||
| Expt C |
2 peptides |
3 spectra |
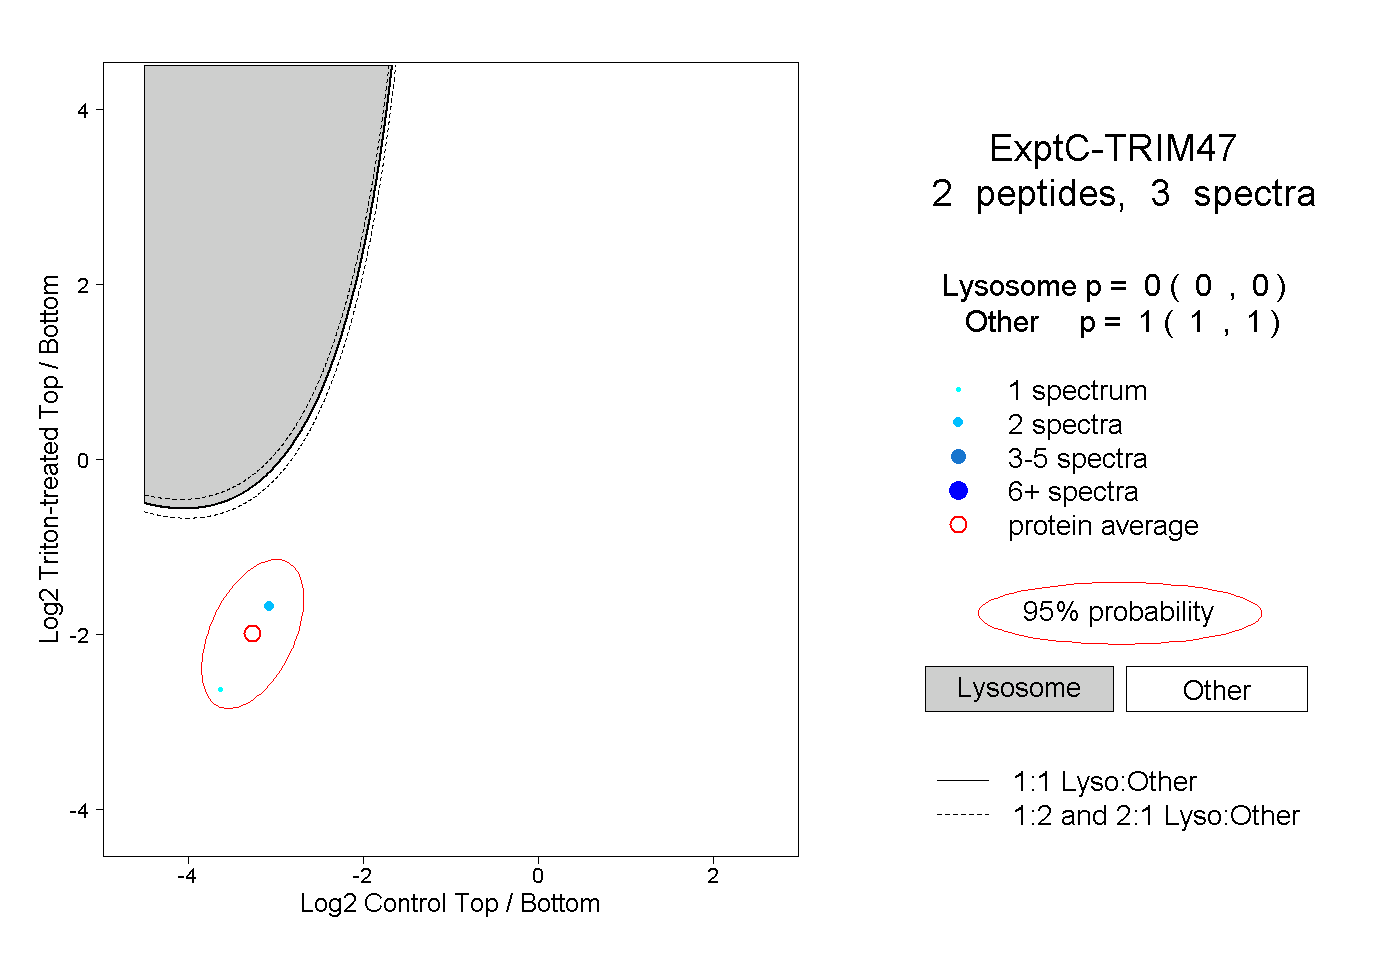 |
0.000 0.000 | 0.000 |
1.000 1.000 | 1.000 |