 3
3peptides
spectra
0.000 | 0.000
0.000 | 0.131
0.000 | 0.171
0.000 | 0.184
0.000 | 0.286
0.026 | 0.387
0.394 | 0.575
0.000 | 0.000
1peptide
spectra
NA | NA
NA | NA
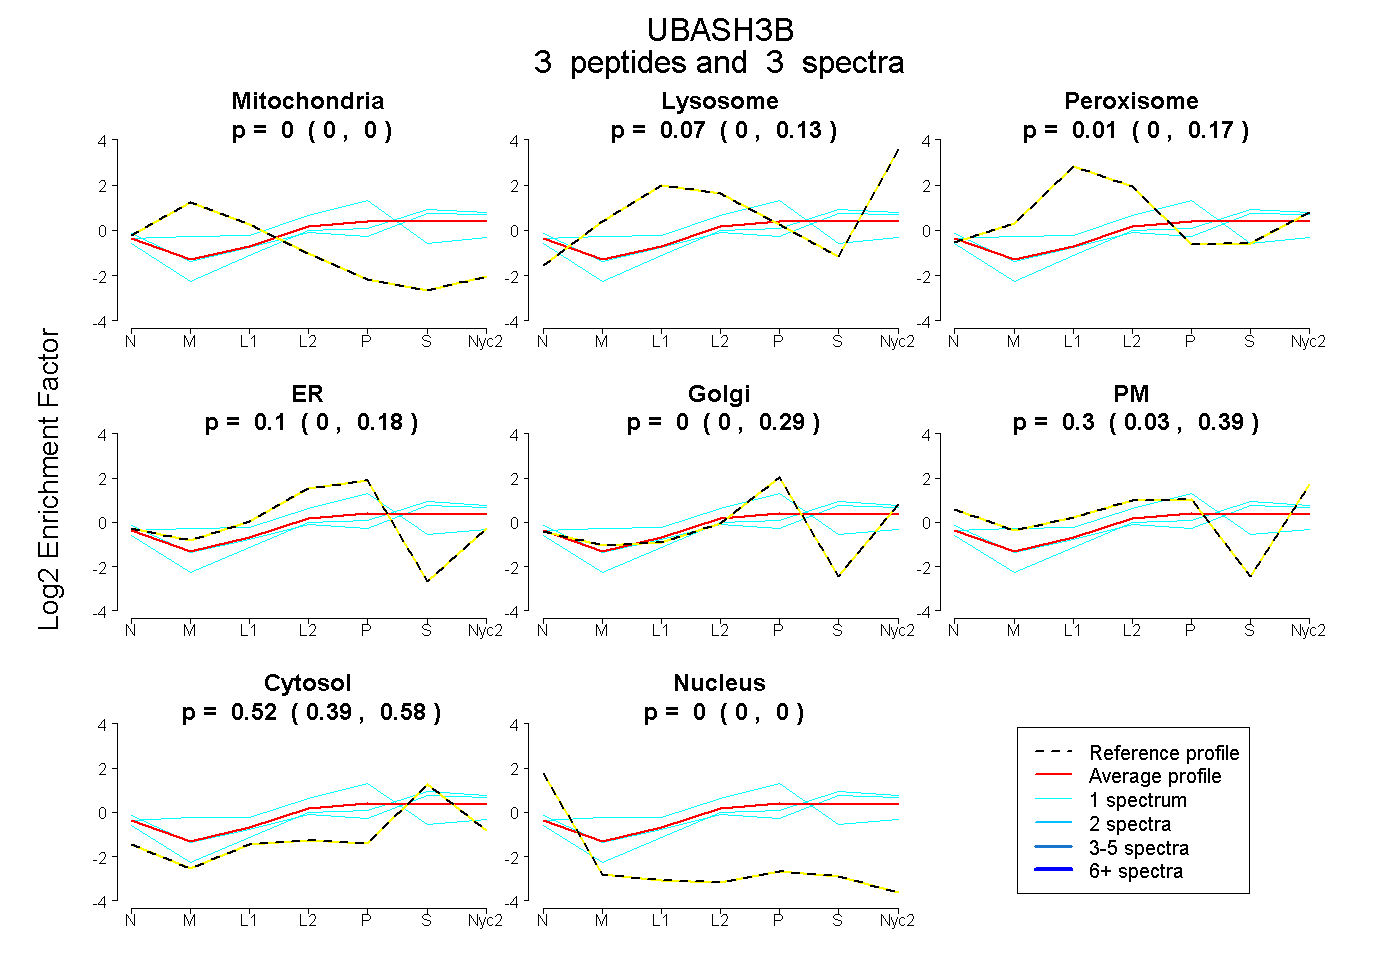
| Plot | Mito | Lyso | Perox | ER | Golgi | PM | Cytosol | Nucleus | |||||
| Expt A |
3 peptides |
3 spectra |
|
0.000 0.000 | 0.000 |
0.073 0.000 | 0.131 |
0.006 0.000 | 0.171 |
0.100 0.000 | 0.184 |
0.000 0.000 | 0.286 |
0.301 0.026 | 0.387 |
0.520 0.394 | 0.575 |
0.000 0.000 | 0.000 |
||
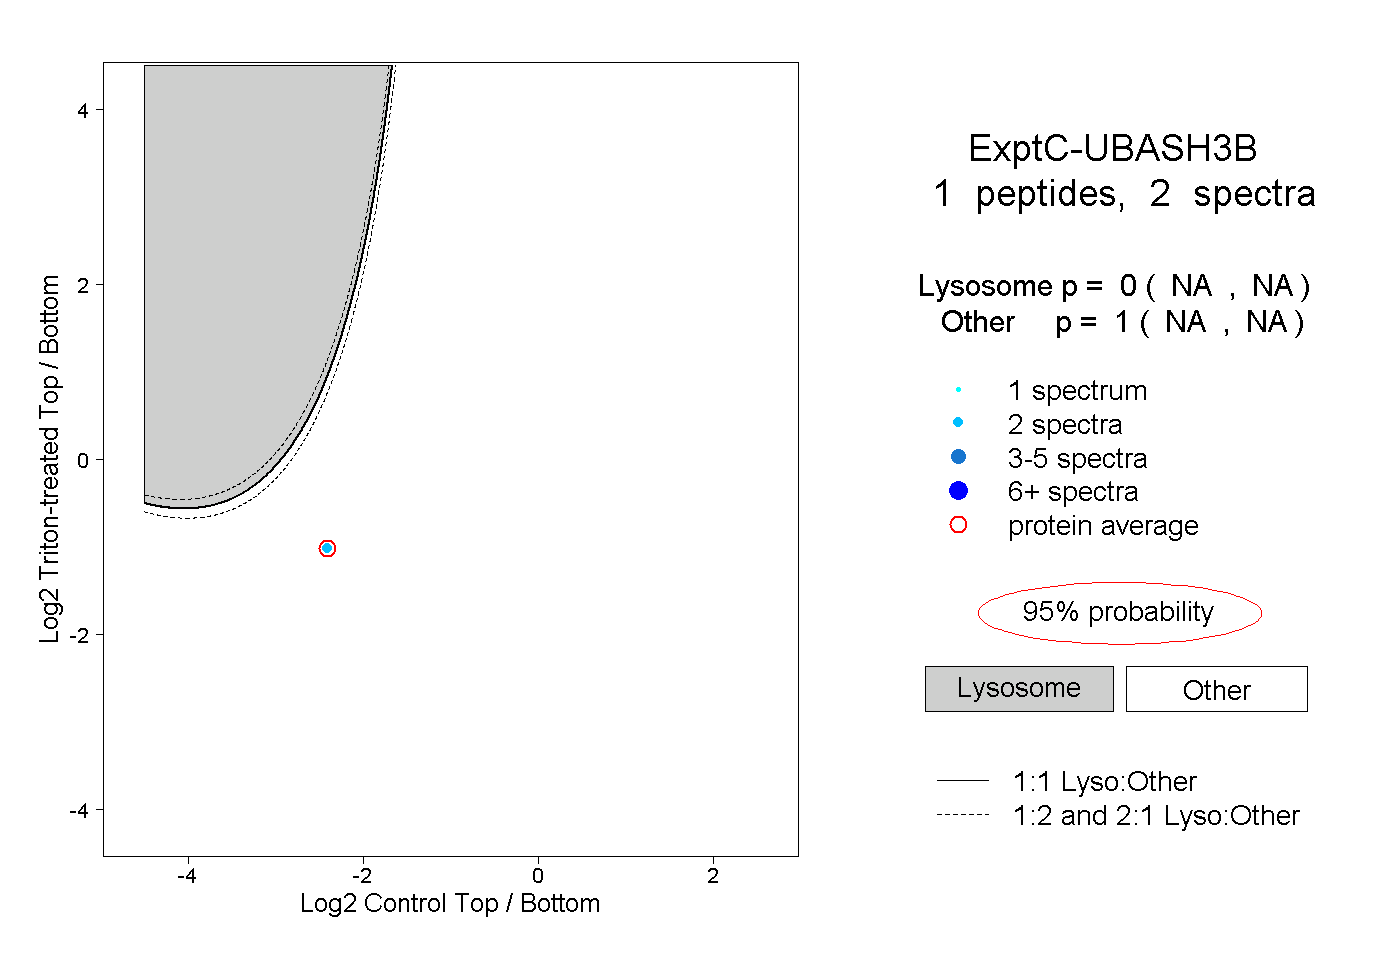
| Plot | Lyso | Other | |||||||||||
| Expt C |
1 peptide |
2 spectra |
|
0.000 NA | NA |
1.000 NA | NA |