 3
3peptides
spectra
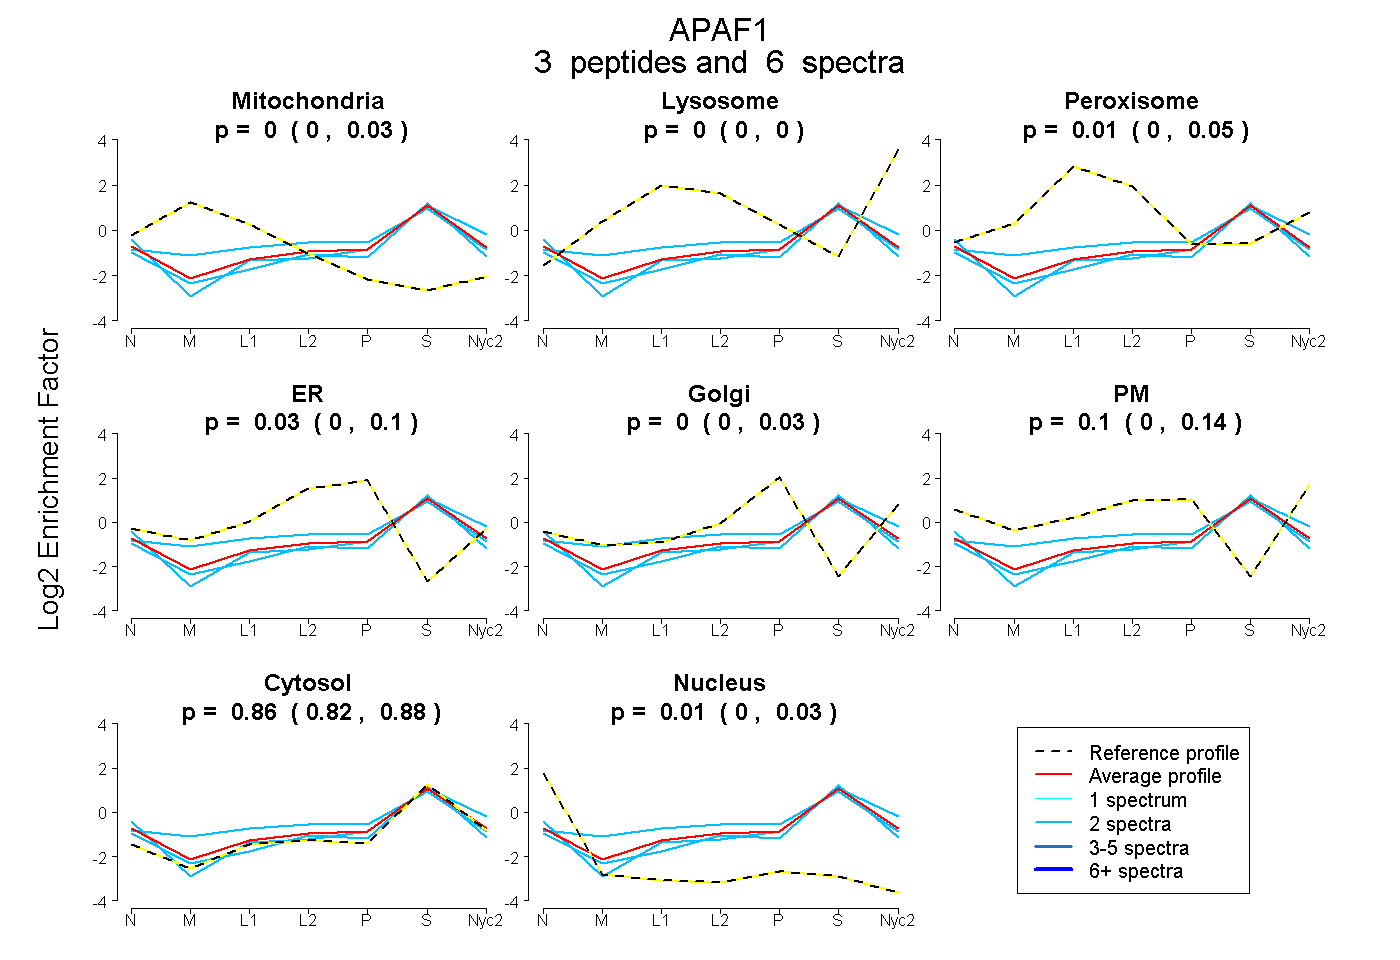
0.000 | 0.031
0.000 | 0.000
0.000 | 0.054
0.000 | 0.095
0.000 | 0.028
0.000 | 0.136
0.818 | 0.877
0.000 | 0.035
| Plot | Mito | Lyso | Perox | ER | Golgi | PM | Cytosol | Nucleus | |||||
| Expt A |
3 peptides |
6 spectra |
|
0.000 0.000 | 0.031 |
0.000 0.000 | 0.000 |
0.007 0.000 | 0.054 |
0.027 0.000 | 0.095 |
0.000 0.000 | 0.028 |
0.098 0.000 | 0.136 |
0.857 0.818 | 0.877 |
0.012 0.000 | 0.035 |
| 2 spectra, TVLCEGGVPQRPVIFVTR | 0.000 | 0.000 | 0.000 | 0.033 | 0.000 | 0.000 | 0.915 | 0.051 | ||
| 2 spectra, SLLFCNR | 0.061 | 0.000 | 0.145 | 0.104 | 0.000 | 0.000 | 0.691 | 0.000 | ||
| 2 spectra, SQATQYQR | 0.000 | 0.000 | 0.000 | 0.000 | 0.000 | 0.116 | 0.863 | 0.020 |
| Plot | Lyso | Other | |||||||||||
| Expt C |
3 peptides |
7 spectra |
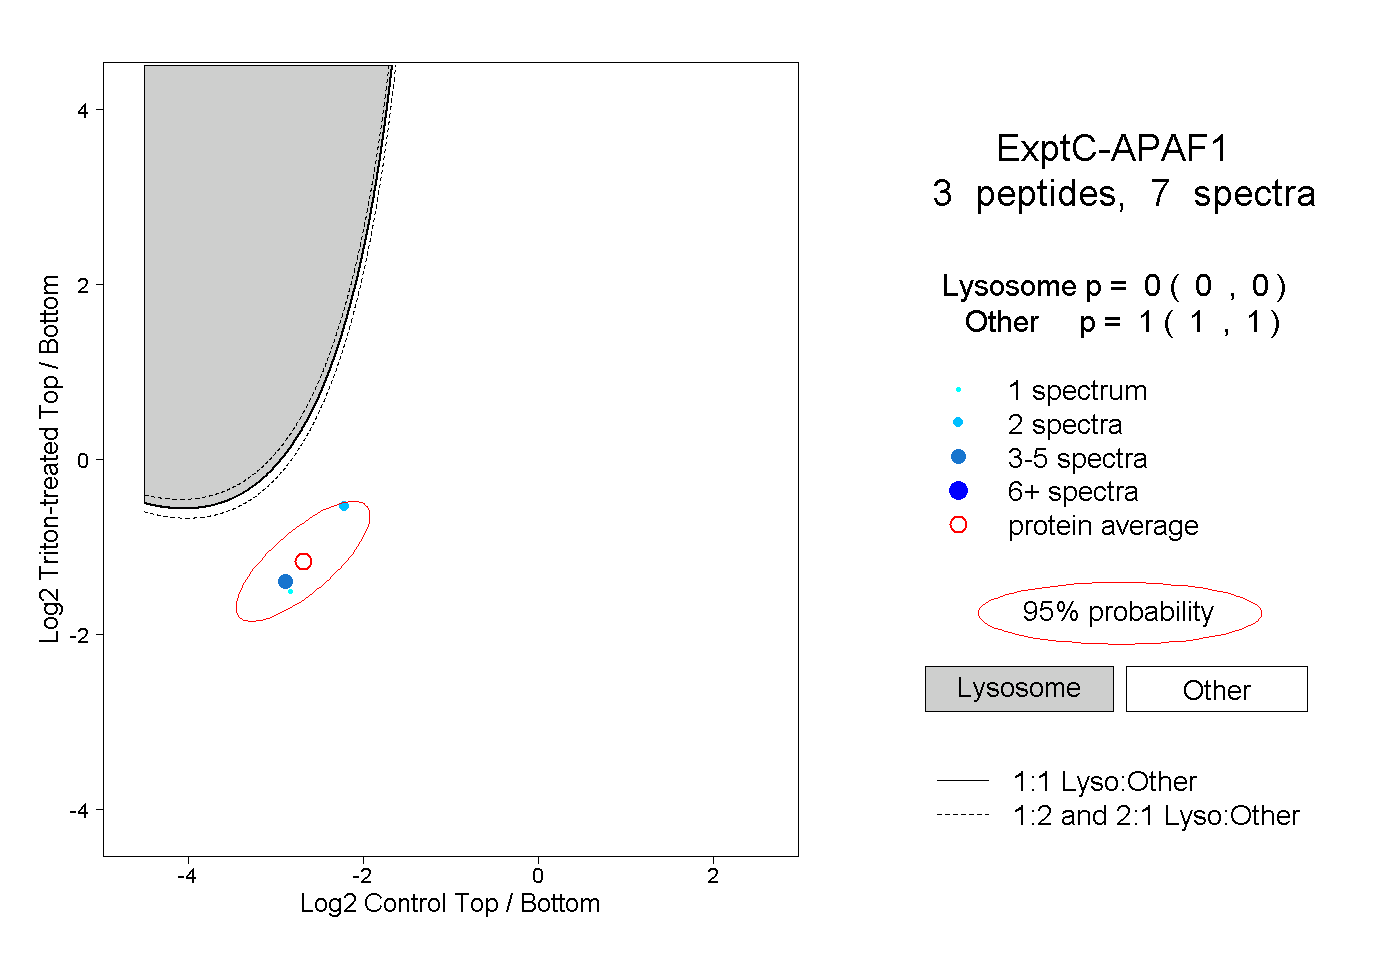 |
0.000 0.000 | 0.000 |
1.000 1.000 | 1.000 |